 2019 was quite the year with many stocks moving sharply higher from January to July-August. In particular, several Technology stocks moved higher during this period and then corrected into October. We can see this pattern reflected in the Equal-Weight Technology ETF (RYT) as it advanced over 40% and then corrected for three months.
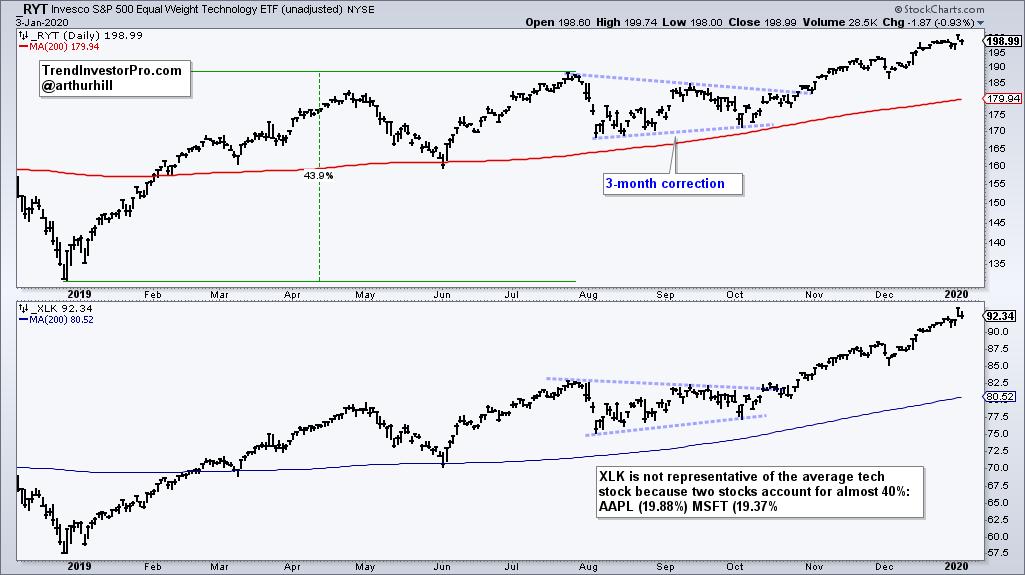
The sideways move from late July to early October represented a rest within the bigger uptrend. This is also a corrective process because RYT needed time to digest the prior gains. Keep in mind that there are at least two types of corrections: time and price. A flat consolidation represents a "time" correction, while a pullback represents a "price" correction.
It is important that chartists accurately assess the structure behind price action. Flat price action and price declines are not always bearish. For example, a stock or ETF is entitled to a rest or a pullback after a big move. This is normal and often represents the pause that refreshes.
With this concept in mind, the chart for Motorola Solutions (MSI) looks promising and poised to end its correction. After an 18-week corrective process, the stock surged some 60% from late December to late August. Again, the stock was entitled to another correction after this move and fell back to the rising 40-week SMA. Also notice that this decline retraced around 38% of the prior advance and formed a falling channel. Both the retracement amount and pattern are typical for corrections within bigger uptrends. MSI gained 1.8% this week and further strength above the red resistance zone would signal an end to this correction, and a resumption of the bigger uptrend.
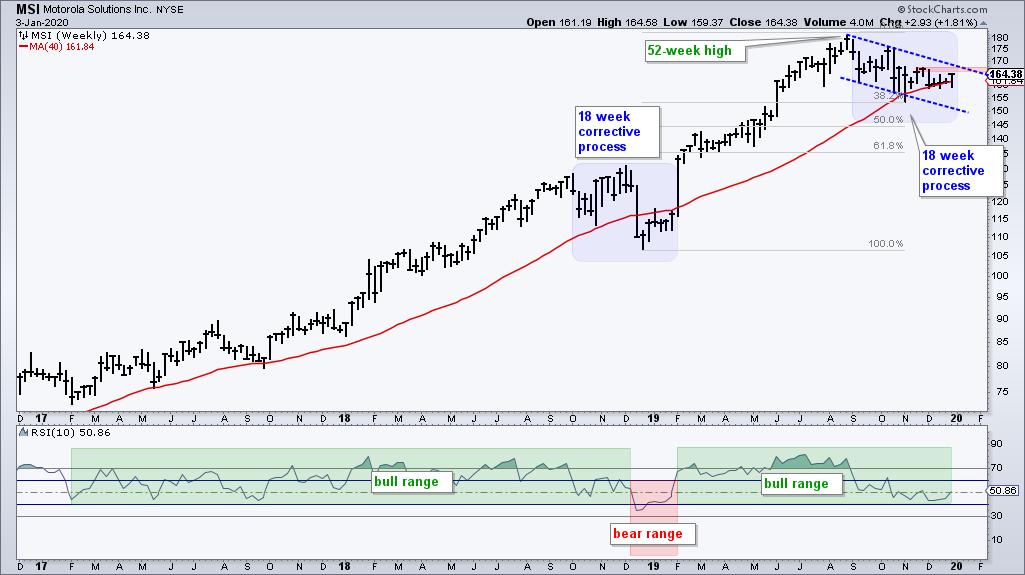
The indicator window shows RSI(10) moving from bull range (40 to 80), to bear range (20 to 60) and back to bull range. We cannot use the exact midpoint (50) as the bull-bear cutoff because this would create too many whipsaws. RSI flattened in the 40 to 50 zone the last two months and this represents momentum support, of sorts.
----------------------------
This weekend at TrendInvestorPro.com, I featured MSI and eight other stocks with bullish continuation patterns at work. These setups come from an array of groups, but these groups have one thing in common: they are strong. These groups include Insurance, Communication Services, Electronic Payments, Medical Devices, Technology and Industrials.
Subscribe today and get immediate access to this report as well as the weekend video and ChartBook featuring 60 ETFs with annotations and comments. StockCharts members that sign up will also receive Arthur's core and master ETF chart lists (260 ETFs). Organized in a top-down manner, these lists make it easy to structure and streamline your analysis process.
Click here for immediate access!
-------------------------
Choose a Strategy, Develop a Plan and Follow a Process
Arthur Hill, CMT
Chief Technical Strategist, TrendInvestorPro.com
Author, Define the Trend and Trade the Trend
Want to stay up to date with Arthur's latest market insights?
– Follow @ArthurHill on Twitter


