 Signs of a correction were building for some time and it now appears that the long awaited corrective period is here. The S&P 500, in particular, is following the script from January 2018 quite closely. After a steady advance from October to December, signs of excess started appearing in mid January. We are now seeing signs of a short-term reversal that would signal the start of a corrective period. Let's look at the details. There is a video link at the bottom of this commentary.
Note that TrendInvestorPro has been following this advance, excess and correction theme since December 20th. The chart below shows weekly candles for the S&P 500 SPDR over the last three years. After a steady advance from September to December 2017, two items showed this advance moving into the "excess" stage in January 2018. First, SPY formed three outsized candlesticks and the weekly gained exceeded 2% in two of the four weeks (red shading).
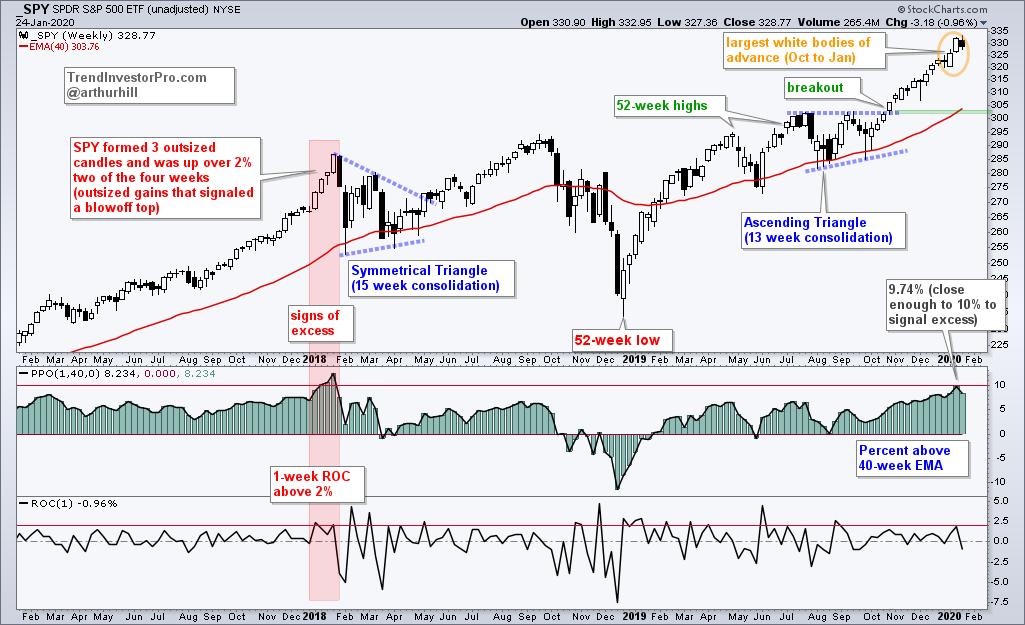
The PPO(1,40,0) provided the second sign of excess as it reached 9.74% in mid January. This means the close was 9.74% above the 40-week EMA. Notice that SPY was more than 10% above its 40-week EMA for three weeks in January 2018. Talk about excess. Even though the PPO did not exceed 10% here in January 2020, I think 9.74% was close enough to warrant caution going forward.
Big gains after an extended decline can signal a bullish reversal, but big gains after an extended advance signal excess that can lead to a bearish reversal or corrective period.
At this point, I am not turning long-term bearish because my breadth models remain bullish and SPY is well above its rising 200-day SMA. Keep in mind that SPY was up some 15% from early October to mid January and a corrective period at this stage would be perfectly normal.
Unfortunately, we do not know what form a correction might take because corrections are like a box of chocolates: you never know what you are going to get. We could get a shallow pullback, a deep retracement, a trading range, a falling wedge/channel or the dreaded surprise.
This weekend at TrendInvestorPro.com, I expanded on this correction thesis and offered some targets for the S&P 500. In particular, there was a clear progression towards defensive names from late December until mid January. This culminated with a breakout the 20+ Yr Treasury Bond ETF on January 15th. Click here to get immediate access to the following and more:
- Weekend Video featuring 60 Core ETFs and more
- Market timing report featuring the breadth models
- ETF Ranking, Grouping and Analysis Report
Click here to take your analysis to the next level!
---------------------
-----------------S&P 500 Channels 2018 and Opens a Box of Chocolates
Choose a Strategy, Develop a Plan and Follow a Process
Arthur Hill, CMT
Chief Technical Strategist, TrendInvestorPro.com
Author, Define the Trend and Trade the Trend
Want to stay up to date with Arthur's latest market insights?
– Follow @ArthurHill on Twitter


