 Amazon is by far the biggest component in the Consumer Discretionary SPDR and its recent breakout bodes well for the ETF. The new highs in XLY and AMZN this month, however, did not carry over to the Equal-weight Consumer Discretionary ETF (RCD). RCD removes the Amazon effect by treating all components equal. In this regard, RCD is a better representative of the Consumer Discretionary sector as a whole.
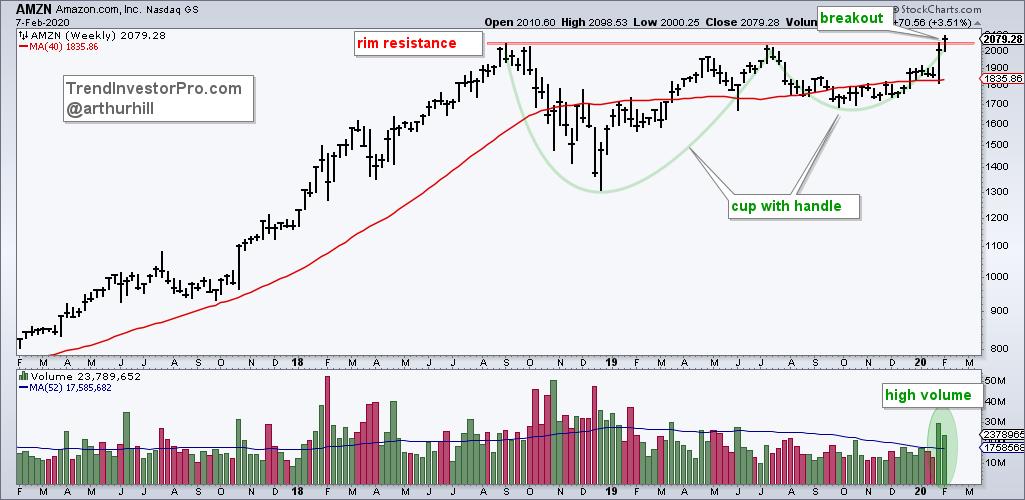
The first chart shows Amazon forming a massive cup-with-handle pattern over the last 17 months. Wow, talk about the mother of all cup-with-handle patterns! Popularized by William O'Neil of IBD, this is a bullish continuation pattern that represents a consolidation within a bigger uptrend. The break above rim resistance, which occurred on expanding volume, confirms the pattern and signals a continuation of the bigger uptrend.
The next chart shows XLY breaking out to a new high in mid December, holding this breakout in late January and hitting another new high in February (thanks, Amazon). As the top holdings show, AMZN accounts for a whopping 26% of the ETF and the recent breakout in Amazon clearly lifted XLY. I would consider this chart long-term bullish as long as XLY holds the breakout zone and rising 40-week SMA (call it 120).
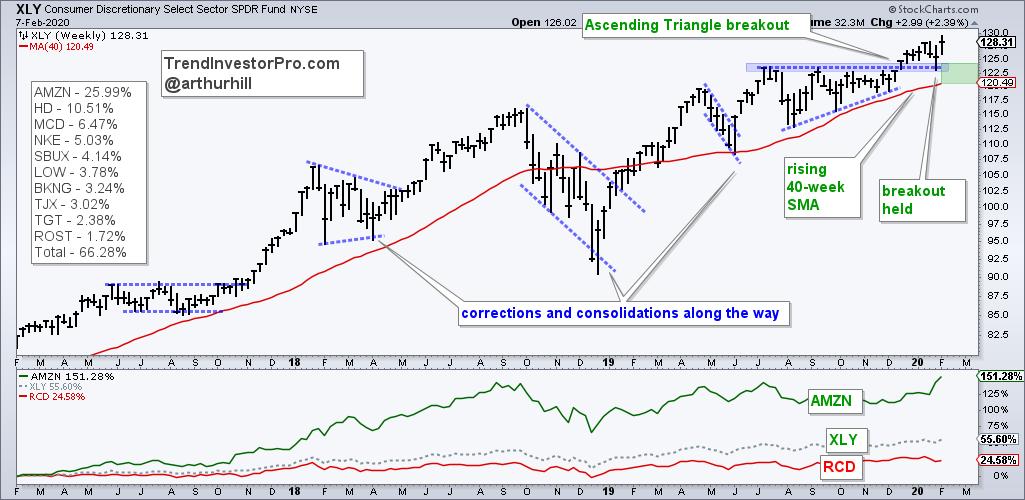
The indicator window shows 3-year price performance for AMZN (+151%), XLY (+55.60%) and RCD (+24.6%). AMZN is up more than three times XLY and XLY is up more than twice RCD. The "Amazon" effect is clearly working its magic for XLY.
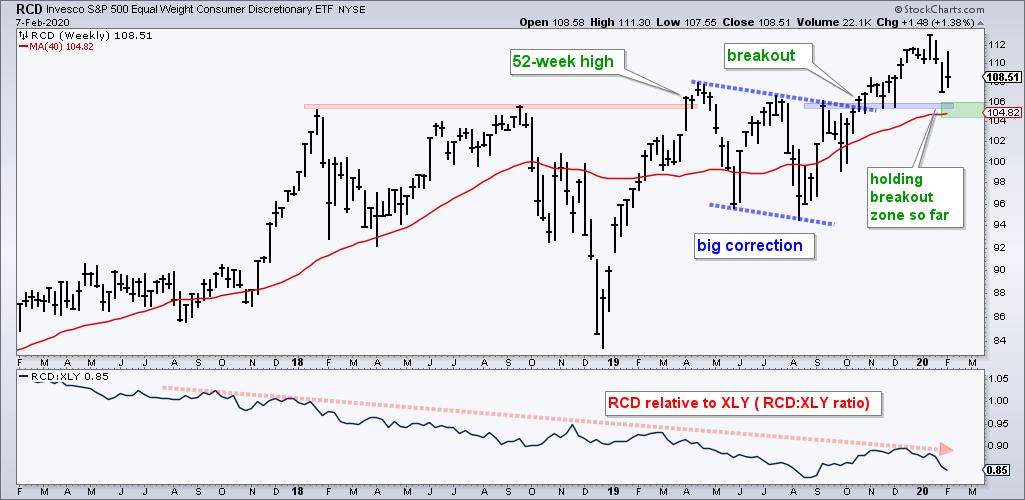
The next chart shows the EW Consumer Discretionary ETF with a breakout in October and new highs in November, December and January. RCD did not hit a new high here in February and is one of only three equal-weight sectors sporting a year-to-date loss (-2.46%). The EW Energy ETF (-10.34%) and EW Materials ETF (-2.53%) are the other two. RCD is holding its breakout and remains in an uptrend for now. I will be watching the breakout zone and 40-week SMA going forward. A close below 104 would be quite negative for the most economically sensitive sector in the stock market.
TrendInvestorPro.com featured Amazon on December 21st as the Bollinger Bands contracted and bandwidth reached a multi-year low. This weekend we featured five stocks from the aerospace and defense group with bullish setups. Subscribe today for immediate access to the following: weekly ETF report, ETF ranking tables, market timing models, ETF ChartBook, weekend video, Saturday stock setups and more.
Click here to take your charting to the next level!
--------------------------
Choose a Strategy, Develop a Plan and Follow a Process
Arthur Hill, CMT
Chief Technical Strategist, TrendInvestorPro.com
Author, Define the Trend and Trade the Trend
Want to stay up to date with Arthur's latest market insights?
– Follow @ArthurHill on Twitter


