 The two most popular biotech ETFs are leading the market this month and making big statements. Before looking at these two, note that they are quite different. The Biotech ETF (IBB) is dominated by large-cap biotechs with the top ten holdings accounting for over 50%. The Biotech SPDR (XBI), on the other hand, is a broad-based ETF with the top ten holdings accounting for less than 25% of the ETF.
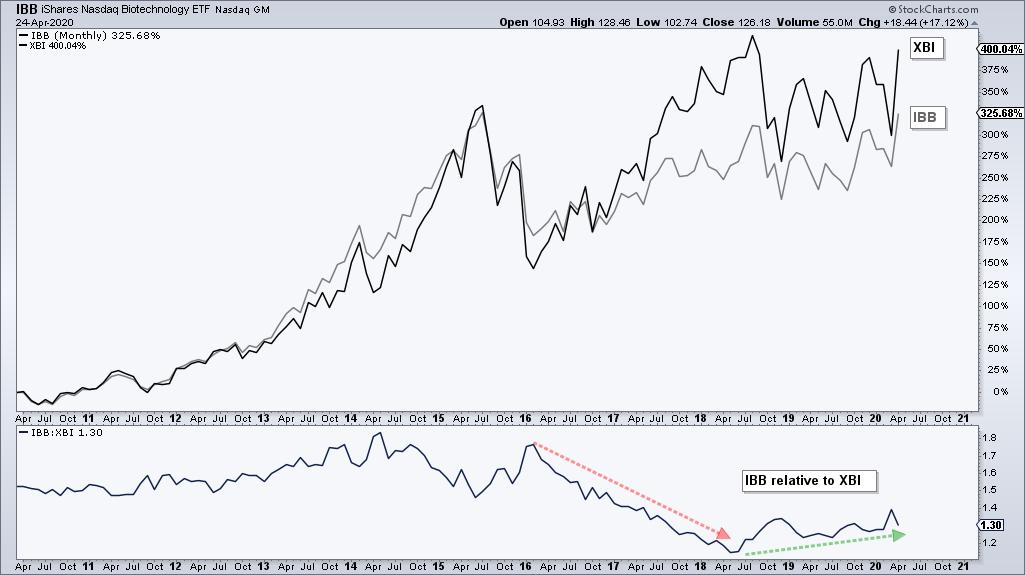
The chart above shows performance for IBB and XBI over the last ten years. XBI (black) is up a whopping 400% and IBB (gray) is up a mediocre 325%. Mediocre is relative in this case! The bottom window shows IBB relative to XBI. After underperforming in 2016 and 2017, large-cap biotechs (IBB) started outperforming again the last two years, though not by much.
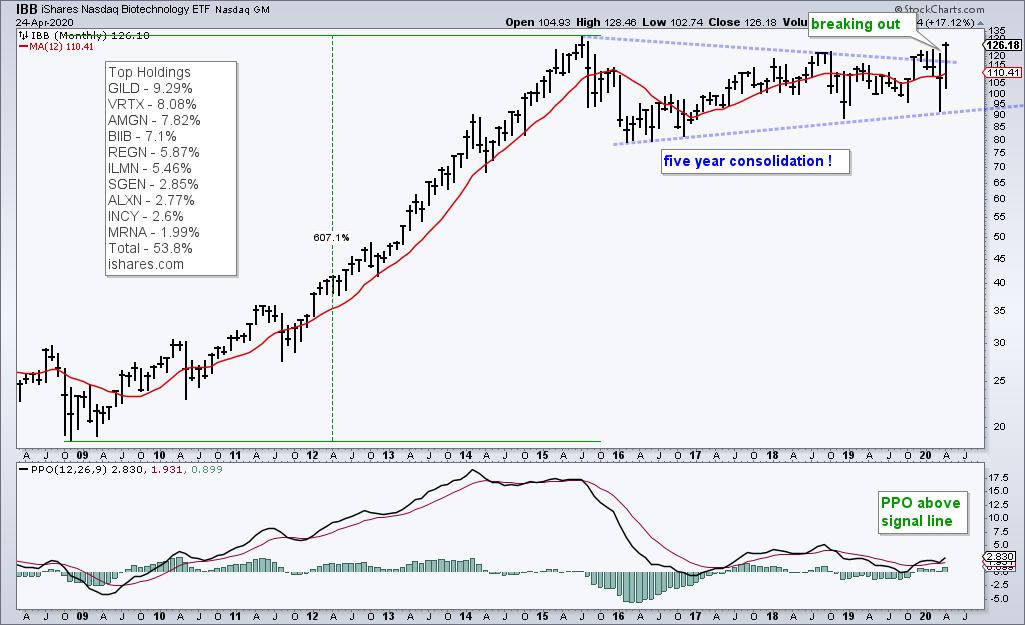
We can also see this outperformance on the monthly price charts. The first chart shows IBB with a massive surge from the 2008 low to the 2015 high and then a five year consolidation. IBB broke out of this consolidation with a big gain this month (provided it holds). Also notice that the PPO(12,26,9) is above its signal line.
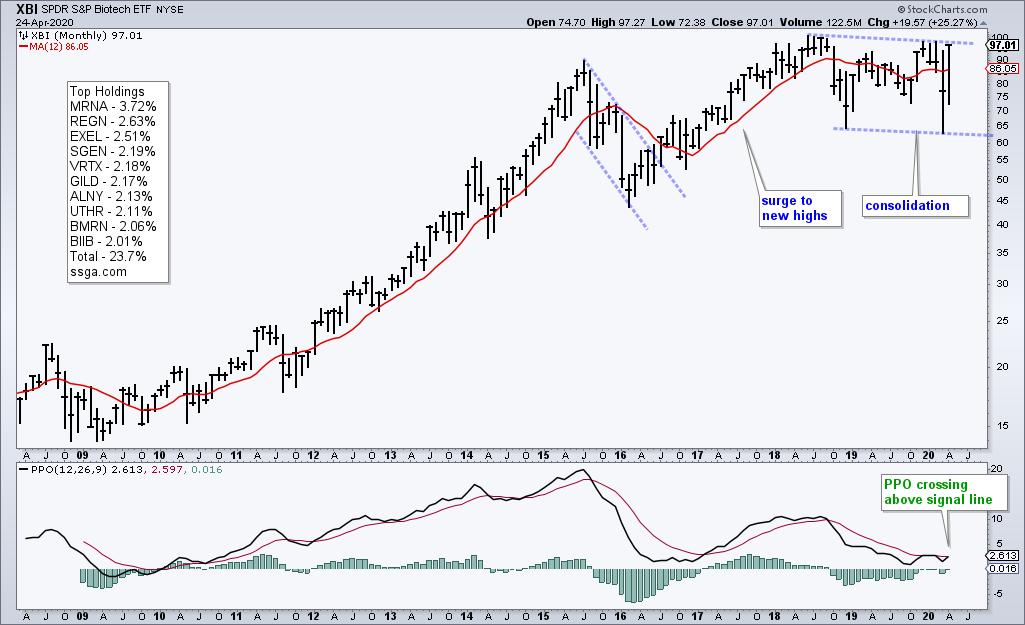
The next chart shows XBI surging more than IBB this month (25% vs 17%), but still short of a breakout. Overall, the pattern at work looks like a surge and consolidation, which is a bullish continuation pattern. A breakout at 100 would open the door to new highs and signal a continuation of the prior advance. Also note that the PPO is turning up.
Even though XBI is outperforming this month, IBB is outperforming overall and represents the better choice from a relative performance standpoint. IBB already broke out and already hit a 52-week high.
This week at TrendInvestorPro.com, I featured monthly charts and secular trends for IBB, the Gold SPDR, the Gold Miners ETF and the 20+ Yr Treasury Bond ETF. Regular reports include the ETF Grouping and Ranking report on Thursday, the Market Timing Models on Friday and a weekly video on Saturdays. Subscribe today for immediate access and we will send you two ready-made ChartLists (200 ETFs organized in a top-down manner and Essential Breadth Indicators for indexes and sector).
Click here to take your analysis to the next level!
-------------
Choose a Strategy, Develop a Plan and Follow a Process
Arthur Hill, CMT
Chief Technical Strategist, TrendInvestorPro.com
Author, Define the Trend and Trade the Trend
Want to stay up to date with Arthur's latest market insights?
– Follow @ArthurHill on Twitter


