 Chartists looking to measure relative performance based on retracements can use the Stochastic Oscillator to quantify these bounces. Way back on March 1st, I posted an article showing how Chartists can quantify downside retracements using Williams %R. For upside retracements or bounces that retrace a portion of the prior decline, we can use the Fast Stochastic.
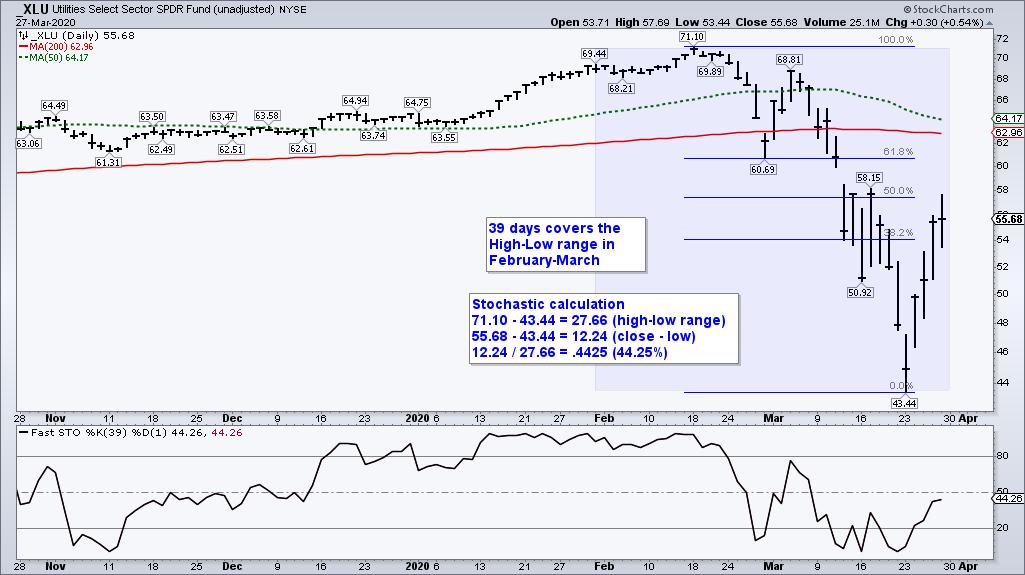
The chart below shows the Utilities SPDR (_XLU) falling from 71.1 to 43.44 and then bouncing to 55.68. The blue shading marks the 39 day range, which covers February and March. The Fibonacci retracement tool shows XLU closing between the 38.2 and 50 percent retracements. The Stochastic calculation reveals that XLU has retraced exactly 44.25% of its prior decline. This is confirmed in the indicator window using the Fast Stochastics (39,1).
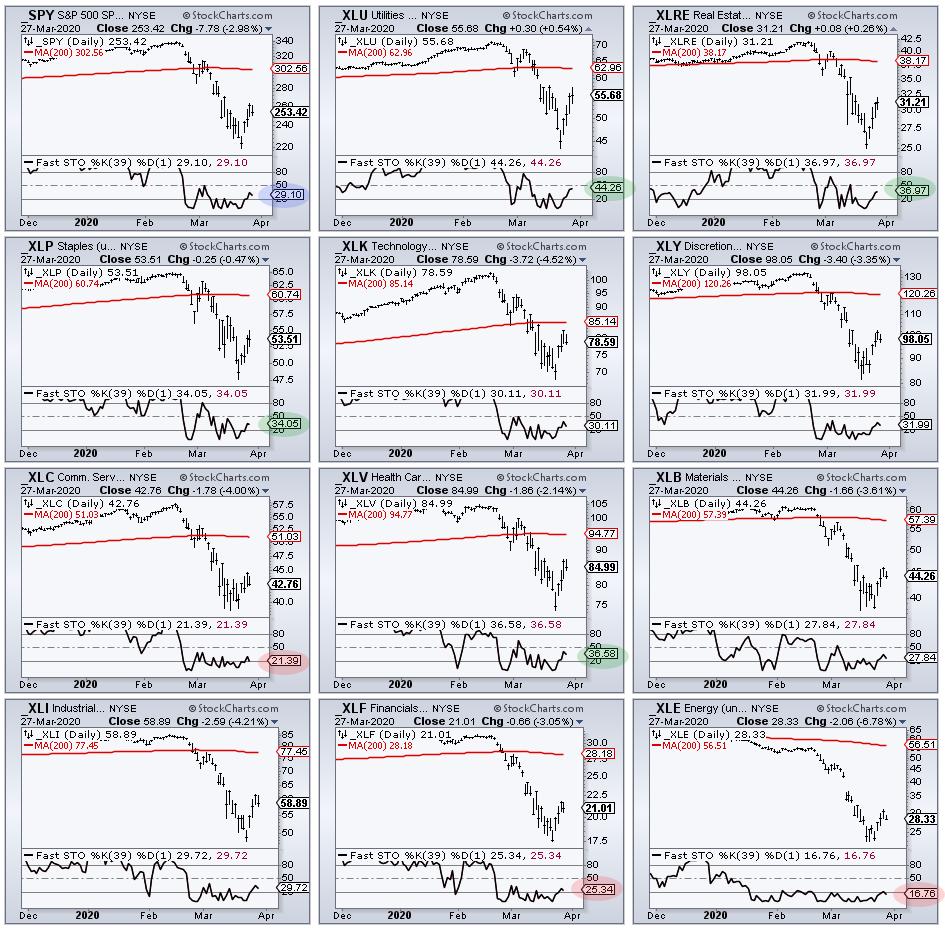
Quantifying retracements allows us to use the Fast Stochastic to compare performance. For example, SPY retraced 29.1% of its February-March decline. Thus, sectors with bigger retracements are leading this bounce, while sectors with smaller retracements are lagging. XLU, XLRE, XLP and XLV are leading the bounce, while XLF, XLC and XLE are lagging with the weakest bounces.
Each week at TrendInvestorPro.com we assess the state of the stock market with our Index and Sector Breadth Models. These offer a systematic and objective weight-of-the-evidence approach to broad market timing. In addition, the following reports were issued this week:
- A Possible Path and Stink Bid for the S&P 500
- Studying the 2008 Credit Shock for Clues on 2020
- Video addition for the Essential Breadth Indicator ChartList
Click here to take your analysis process to the next level!
------------------------------------
Choose a Strategy, Develop a Plan and Follow a Process
Arthur Hill, CMT
Chief Technical Strategist, TrendInvestorPro.com
Author, Define the Trend and Trade the Trend
Want to stay up to date with Arthur's latest market insights?
– Follow @ArthurHill on Twitter


