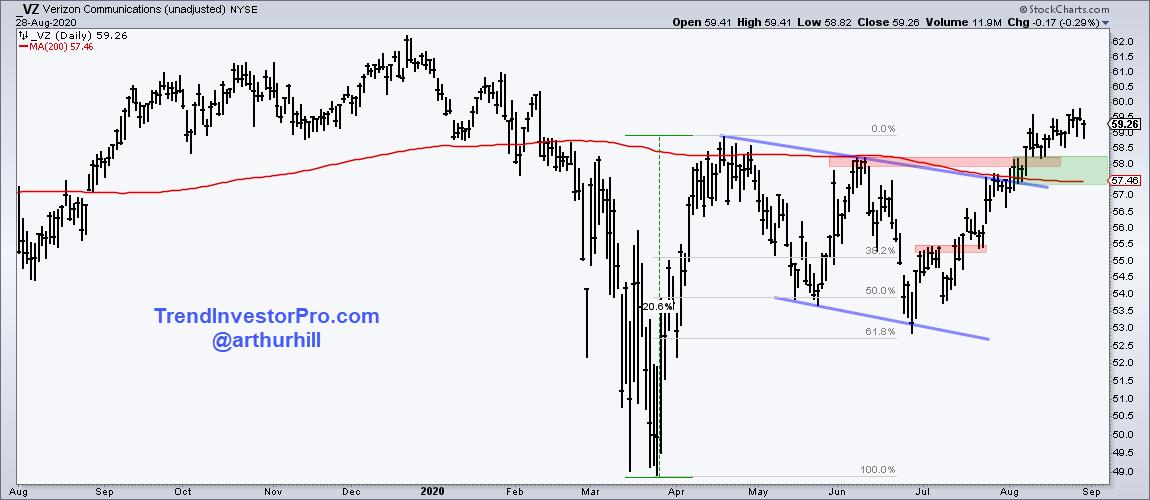
 Verizon (VZ) participated in the market surge from late March to mid April, but then stumbled with a decline into mid June. This stumble, however, looks like a classic correction and the stock broke out with a strong move over the last six weeks. In addition, the TIP Trend Composite, which aggregates five trend-following indicators turned positive in early August. Let's investigate.
The decline from mid April to mid July looks like a classic correction and the breakout opens the door to a Measured Move. First note that the decline retraced 50-62% of the prior advance. This amounts to a two-step forward and one-step backward sequence. Second, the declined formed a big falling channel and VZ broke out of this channel. The breakout opens the door to two more steps forward. Using the Measured Move technique, this would argue for a 20.6% advance off the late June low and project a move to the mid 60s. The breakout zone in the 57-58 area turns first support to watch should there be a throwback.
Part of the TrendInvestorPro Indicator Edge Plugin, the TIP Trend Composite is a trend-following indicator based on five indicators set on the six month timeframe (125 days):
- 125-day SMA Direction
- CCI Close (125)
- Bollinger Bands (125,1)
- Keltner Channels (125,2)
- StochClose (125,5)
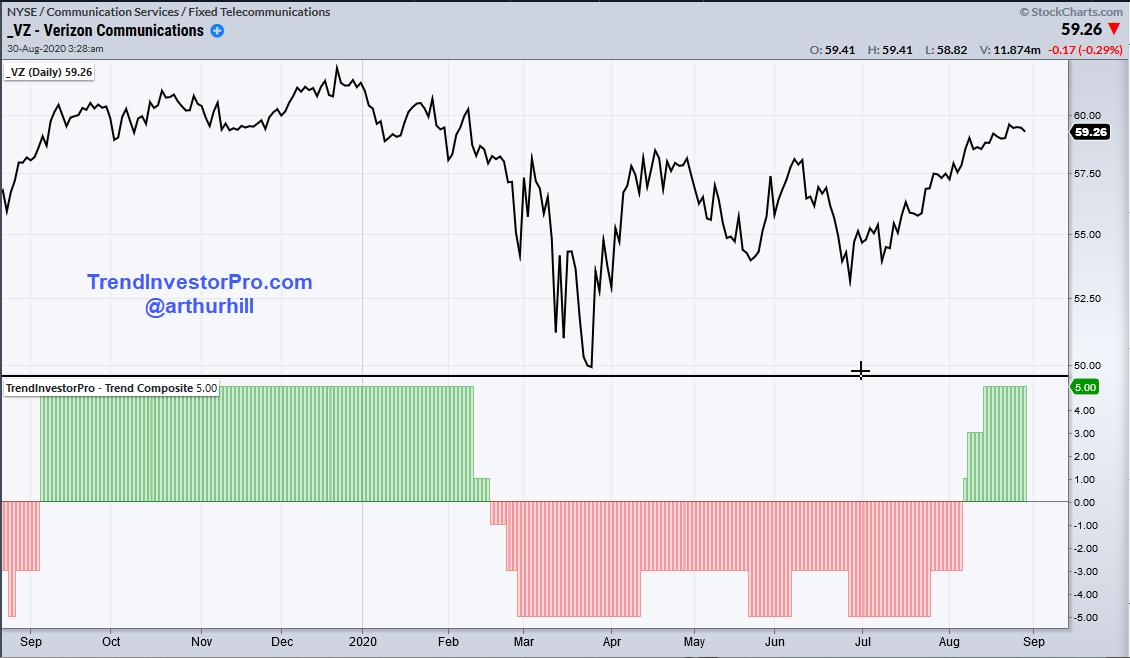
The chart below shows the TIP Trend Composite moving from -3 to +1 on August 7th. When -3, four indicators were on active bearish signals and one was bullish (1 - 4 = -3). The move to +1 meant that three indicators were on active bullish signals and two were bearish (3 - 2 = +1). The rest of the indicators followed with bullish signals a week later and all five are currently bullish. The trend is considered up as long as the Trend Composite remains positive.
Keep in mind that trend-following indicators are always late to the party and lag. In other words, they are "following", not leading. In addition, trend-following strategies have win rates in the 40% area, which means 60% of trades end up as losers. The strategy makes money because, over time, a few good trends pay for the losing trades.
Looking for trend, momentum and pattern strategies? Focusing mostly on ETFs, TrendInvestorPro.com ranks a core list of ETFs according to StochClose (125,5) for momentum and trend strategies. In addition, this core list is grouped and ranked according to price pattern and trend characteristics. The charts are organized in a ChartBook with annotations and comments. Click here to take your analysis to the next level!
Here is a support article that explains the indicators in this plugin and shows chart examples. Those interested in the plugin and view the pricing page here.
--------------------------------------------------------------
Choose a Strategy, Develop a Plan and Follow a Process
Arthur Hill, CMT
Chief Technical Strategist, TrendInvestorPro.com
Author, Define the Trend and Trade the Trend
Want to stay up to date with Arthur's latest market insights?
– Follow @ArthurHill on Twitter


