 The S&P 500 SPDR (SPY) fell over 2% this week for the biggest weekly decline since June. The long-term trend is still up because SPY remains well above the rising 40-week SMA. However, a big Spinning Top candlestick formed last week and a volatility indicator ticked higher. Spinning Tops signal indecision that can sometimes foreshadow a reversal, while an increase in volatility is normally associated with price weakness. The combination could signal the start of a corrective period.
The chart below shows the Spinning Top marked by the blue oval. SPY tagged new 52-week highs the last three weeks and then formed a big indecisive candlestick this past week. Spinning Tops reflect a raging battle between bulls and bears during the week as price surged to 358.75 on the high and fell to 334.87 on the low. The black body of the candlestick represents the open-close range and this is right in the middle of the high-low range. Basically, price action was all over the place during the week, but ended near the middle of the range for a stalemate of sorts (indecision).
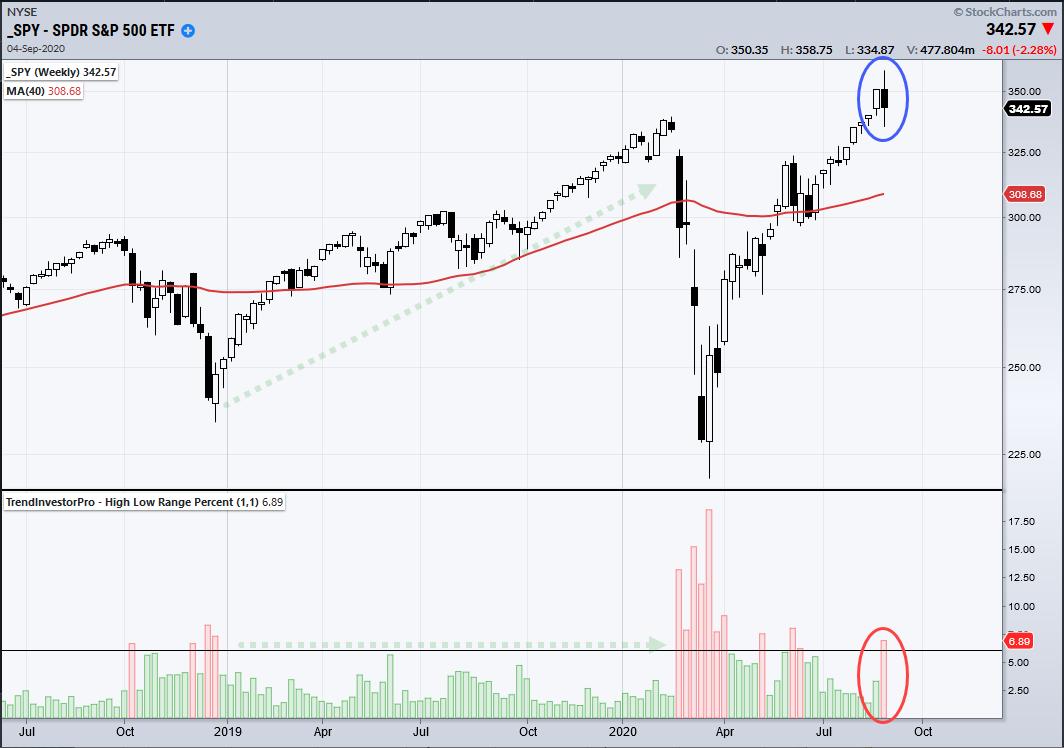
The big high-low range (23.88 points) also signals an increase in volatility, which is captured by the High-Low Range Percent indicator. This is a massive range that amounts to 6.9% of the closing price, the highest since mid June. The lower window shows this indicator with a red bar on the last day because it finished above the reference line (6). Notice how volatility was low when SPY trended higher from late 2018 until mid February. Low volatility is usually associated with price strength, while high volatility is associated with price weakness.
At this point, SPY simply shows big indecision after an extended advance and a one-week uptick in volatility. The bulls still have control, but the ETF is very extended after a 50+ percent advance since March and a 20% advance from the June low to the September high. A decline from this Spinning Top would turn indecision into a reversal and argue for a correction, possibly back to the rising 40-week SMA. In the meantime, I am going to put on the headphones on and go back to the 80s for You Spin Me Round by Dead or Alive. Warning: don't watch the video!
High-Low Range Percent is part of the TrendInvestorPro Indicator Edge Plug-In for StockCharts ACP. Here is a link for explanations with chart examples and here is a link for pricing.
TrendInvestorPro.com specializes in breadth models for broad market timing, trend-momentum strategies and an ETF chartbook that is organized according to trend/pattern characteristics. Click here for more information.
-------------------------------------------------------
Choose a Strategy, Develop a Plan and Follow a Process
Arthur Hill, CMT
Chief Technical Strategist, TrendInvestorPro.com
Author, Define the Trend and Trade the Trend
Want to stay up to date with Arthur's latest market insights?
– Follow @ArthurHill on Twitter


