Art's Charts September 26, 2020 at 10:20 AM
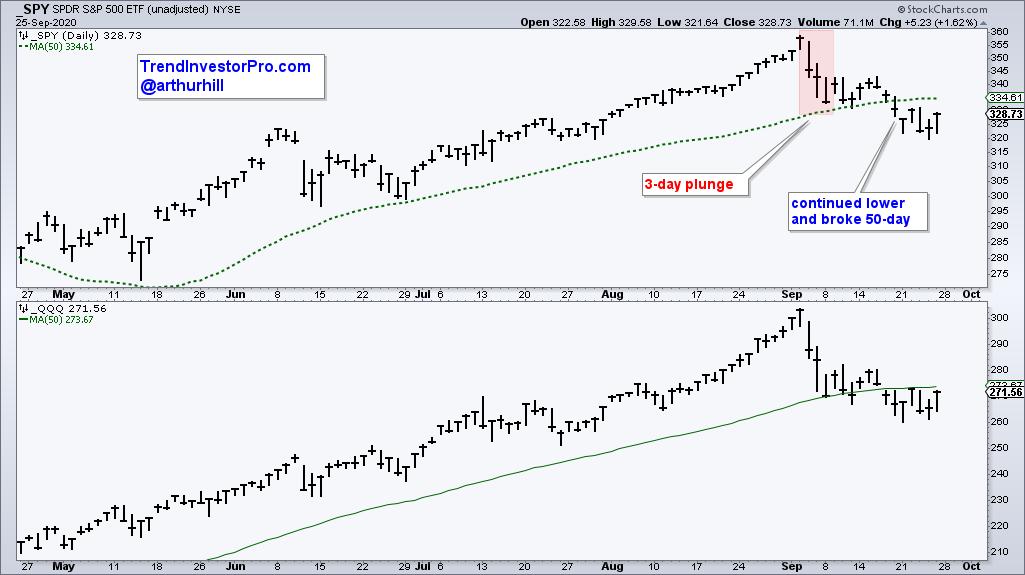
The S&P 500 SPDR is down around 6% this month and QQQ is down around 8%. These two hit new highs on September 2nd, plunged the next three trading days and then worked their way lower. Both are below their 50-day moving averages for the first time since April... Read More
Art's Charts September 11, 2020 at 10:40 AM

There are fewer silver crosses in the major stock indexes and this shows less participation during the last leg higher, a situation that could foreshadow a correction. A silver cross occurs when the 20-day EMA crosses above the 50-day EMA... Read More
Art's Charts September 06, 2020 at 03:46 AM

The S&P 500 SPDR (SPY) fell over 2% this week for the biggest weekly decline since June. The long-term trend is still up because SPY remains well above the rising 40-week SMA. However, a big Spinning Top candlestick formed last week and a volatility indicator ticked higher... Read More