 There are fewer silver crosses in the major stock indexes and this shows less participation during the last leg higher, a situation that could foreshadow a correction.
A silver cross occurs when the 20-day EMA crosses above the 50-day EMA. DecisionPoint took this concept on step further and developed breadth indicators based on the percentage of stocks with silver crosses. This is a great way to look under the hood and aggregate medium-term trend performance for each index.
The chart below shows this indicator for four key indexes: $NDX, $SPX, $MID and $SML. I set the bullish and bearish thresholds at 60% and 40%. Note that I refrain from using the exact middle (50%) to reduce whipsaws. I then added a 20-day EMA to gauge general direction. This gives us two signals to watch. Short-term, silver crosses are increasing/decreasing when above/below the 20-day EMA and this is bullish/bearish. Long-term, a move above 60% is considered bullish and a move below 40% is considered bearish.
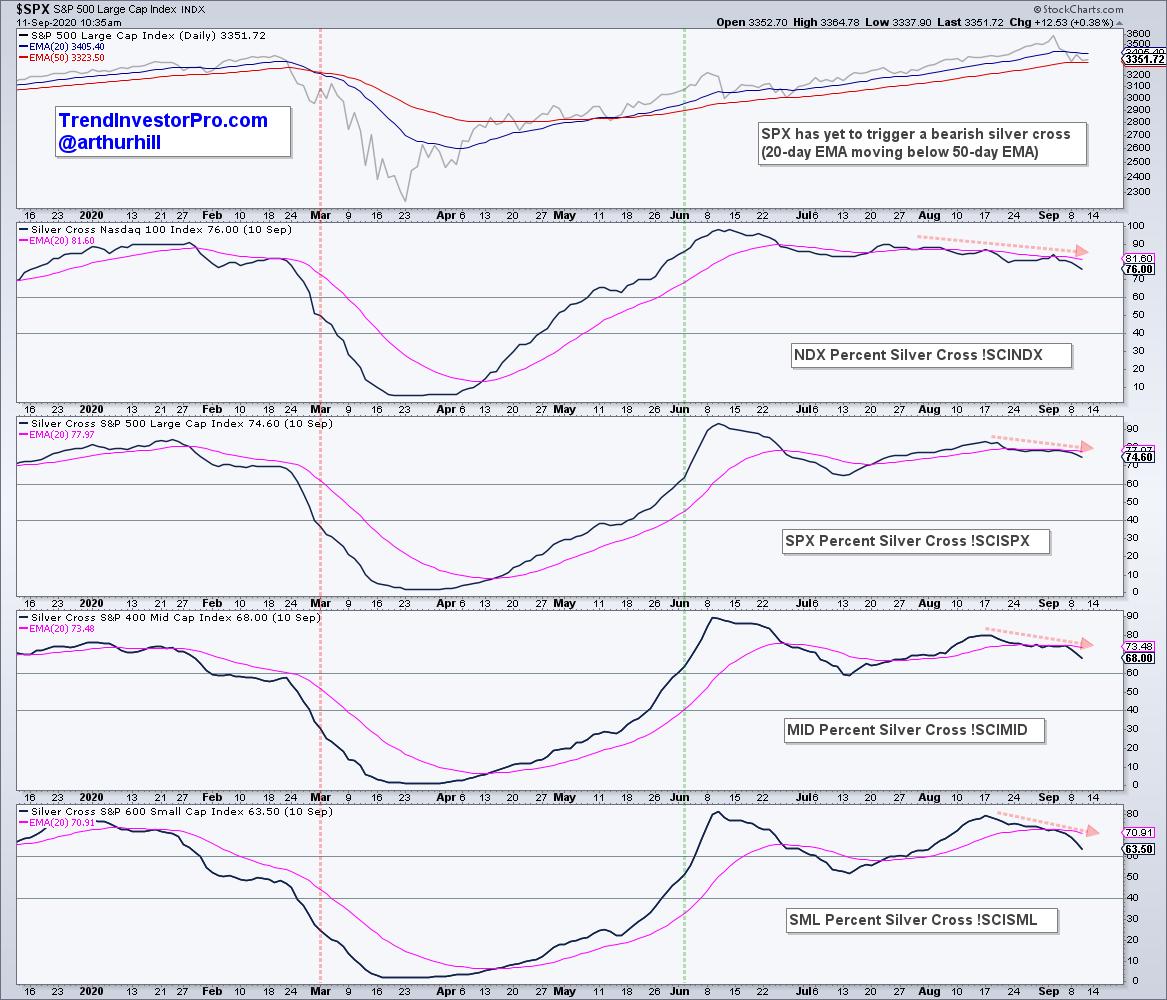
All four lines peaked in June with relatively high readings as NDX, SPY and MID exceeded 90% and SML exceeded 80%. Even though each index moved above its June high, the percentage of stocks with silver crosses did not expand. This means we are seeing slightly less participation during the summer leg higher. All four lines turned down over last few weeks and moved below their 20-day EMAs. This is short-term bearish because the percentage of stocks with silver crosses is declining. The group would turn long-term bearish should two of the four move below 40%. Pro Tip: You can change the SC to GC in the symbols to see the golden cross indicators (!SCISPX to !GCISPX).
Note that I will join John Bollinger, Martin Pring, Linda Raschke, Craig Johnson and others this Saturday for the TSAA-SF annual conference, which will be virtual via Zoom. My presentation will cover trend-following strategies for the broader market and stocks in the S&P 500. I will quantify some old school indicators and then turn to a new school version of RSI for trend-following. Hope you can join us!
Interested in breadth charts? Subscribe to TrendInvestorPro.com and get the Essential Breadth Indicator ChartList as a subscription bonus. Containing over 100 charts, this list is organized by index and sector in a logical top-down format. We also developed and tested breadth models for five broad indexes. These are part of a weekly broad market timing report and breadth indicator chartbook.
Click here to take your analysis to the next level
---------------------------------------------------------
Choose a Strategy, Develop a Plan and Follow a Process
Arthur Hill, CMT
Chief Technical Strategist, TrendInvestorPro.com
Author, Define the Trend and Trade the Trend
Want to stay up to date with Arthur's latest market insights?
– Follow @ArthurHill on Twitter


