 The Consumer Discretionary SPDR (XLY) is leading the charge with the most stocks trading above their 200-day EMAs. The table below shows the percentage of stocks above their 200-day EMAs for three indexes and the eleven sectors. This indicator is above 98% for XLY and above 90% for four other sectors (XLF, XLC, XLB and XLI). In addition over 80% of stocks are above their 200-day EMA for four more (XLK, XLP, XLRE, XLE). Healthcare and Utilities are the laggards, but even these sectors have more than 78% of stocks above the 200-day EMA. Overall, these strong readings reflect broad participation in the current advance.
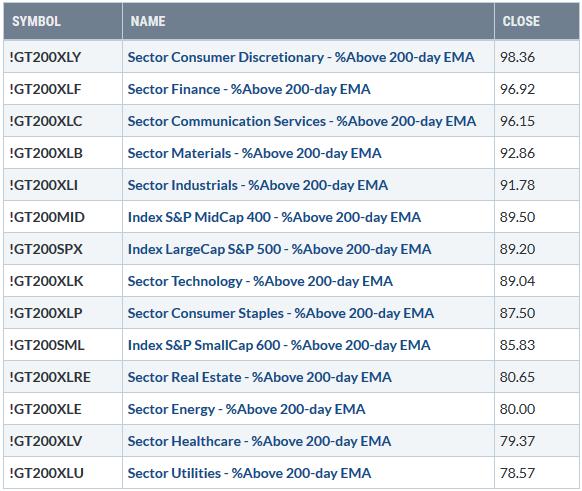
Some of these indicators are hitting extremes, but this is not always bearish. For example, XLY %Above 200-day EMA (!GT200XLY) hit its highest level since April 29th, 2010. This extreme foreshadowed a corrective period the following two months. Extremes make for interesting observations, but they are not very helpful when it comes to timing. The chart below shows when %Above 200-day EMA exceeded 90% (red zones) and the prior four occurrences lasted for three to nine months. These are classic cases of becoming overbought and remaining overbought.
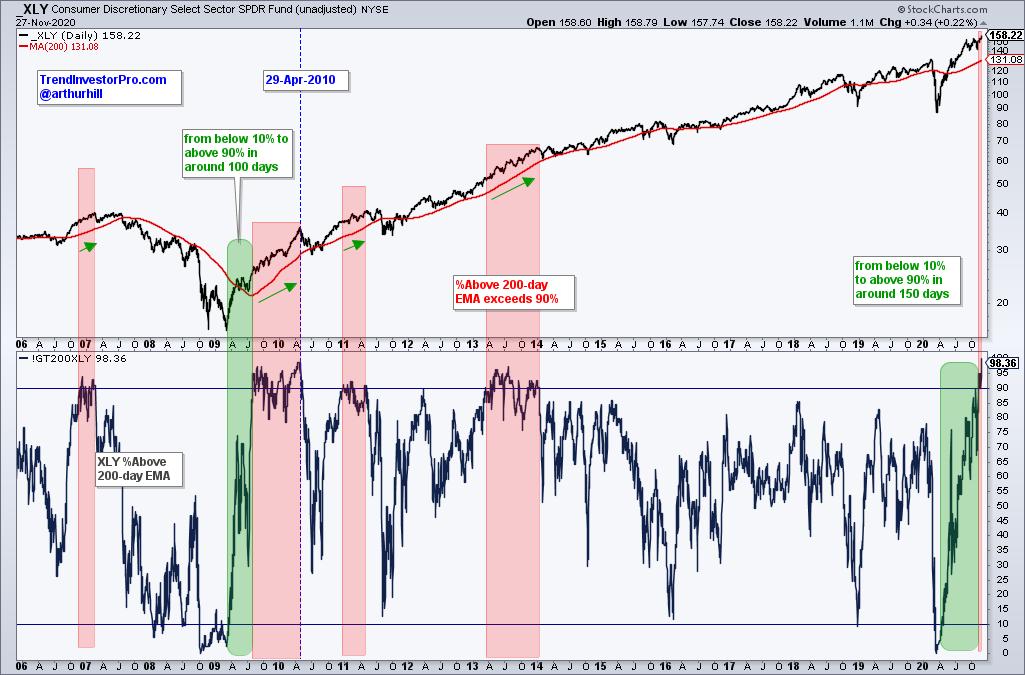
The green zones show when the indicator moved from below 10% to above 90% and there are only two instances: March to July 2009 and April to November 2020. These instances reflect a remarkable shift from a bearish extreme to a bullish extreme. In 2009, XLY continued higher from July 2009 until April 2010. This indicator may seem extended here in November 2020, but keep in mind that it takes strong buying pressure to produce such readings and this is more bullish than bearish.
Today is the day to get sector-specific breadth indicators like these and four months free. StockCharts is offering their biggest deal of the year on Cyber Monday (November 30th). Renew or sign up and get four months free! Click here for details.
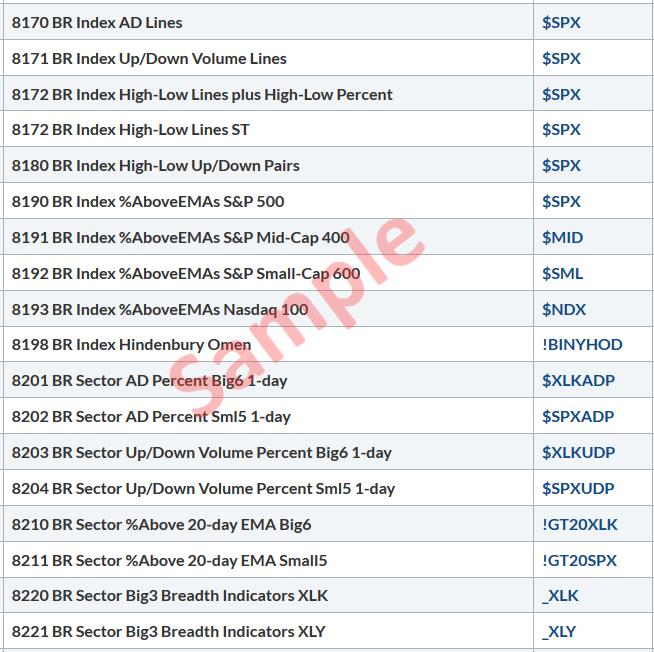
Looking for more breadth charts like these? StockCharts members who sign up to TrendInvestorPro.com get access to the Essential Breadth Indicator ChartList. Using dozens of breadth indicators, this list contains over 100 customized breadth charts organized in a logical top-down manner. Click here for details.
Choose a Strategy, Develop a Plan and Follow a Process
Arthur Hill, CMT
Chief Technical Strategist, TrendInvestorPro.com
Author, Define the Trend and Trade the Trend
Want to stay up to date with Arthur's latest market insights?
– Follow @ArthurHill on Twitter


