 The weekly high-low range for the Nasdaq 100 ETF (QQQ) was the narrowest of the year this past week and the ETF is battling triangle resistance. A narrowing range shows indecision and a volatility contraction. Even though this is just one weekly bar, QQQ is at a moment of truth. Will we see a triangle breakout and continuation higher or a failure at resistance and extended correction? There is also a video link at the bottom of this article.
Let's first look at the narrow range using High-Low Range Percent, which is part of the TrendInvestorPro Indicator Edge plugin for StockCharts ACP. On this weekly chart, High-Low Range Percent is set as follows: smoothing periods = 1 (not smoothed), signal periods = 1 (no signal line) and reference = 2% (horizontal line).
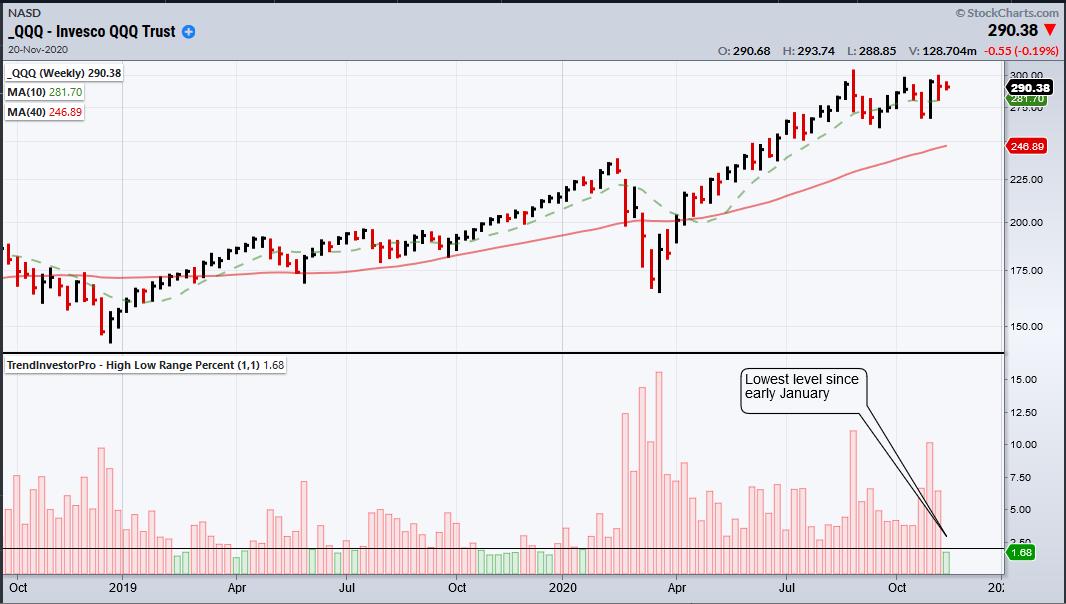
As a percentage of the close, the high-low range is at 1.68% and this is the narrowest range since the third week of January. Trading turned real quiet this week and QQQ could be preparing for a move. However, this is not a stand alone indicator and this one week volatility contraction should be put in context. First, note that QQQ hit a new high in early September and remains well above the rising 40-week SMA. Now let's check the daily chart for a directional bias.
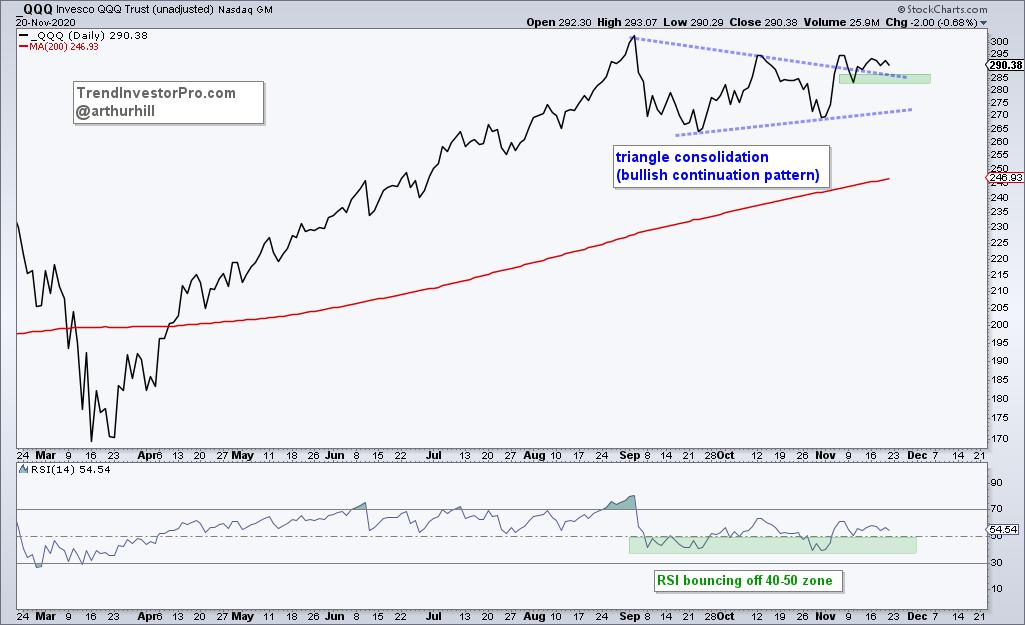
After hitting a new high in September and advancing over 70%, QQQ formed a triangle consolidation and digested this monster gain. Notice that I am using a close-only chart to filter out some of the noise. QQQ is attempting to breakout of this triangle and signal a continuation higher. In fact, the cup is currently half full and would remain so as long as the green support zone holds. A close below the November 10th close would put QQQ back into the triangle and back in consolidation mode. Chop, chop, chop.
Exit Strategies are an important part of trading and these were covered with an article and video on TrendInvestorPro.com this week. We covered the Trend Reversal Exit, Chandelier Exit, Parabolic SAR and the ATR Trailing Stop. Subscribers also receive immediate access to the breadth models, the comprehensive ETF report, the annotated ChartBook and weekend video.
Click here to take your analysis to the next level!
-----------------------------------------------
The Calm before the Storm in QQQ
-----------------------------------------------
Choose a Strategy, Develop a Plan and Follow a Process
Arthur Hill, CMT
Chief Technical Strategist, TrendInvestorPro.com
Author, Define the Trend and Trade the Trend
Want to stay up to date with Arthur's latest market insights?
– Follow @ArthurHill on Twitter


