Art's Charts May 23, 2021 at 10:06 AM
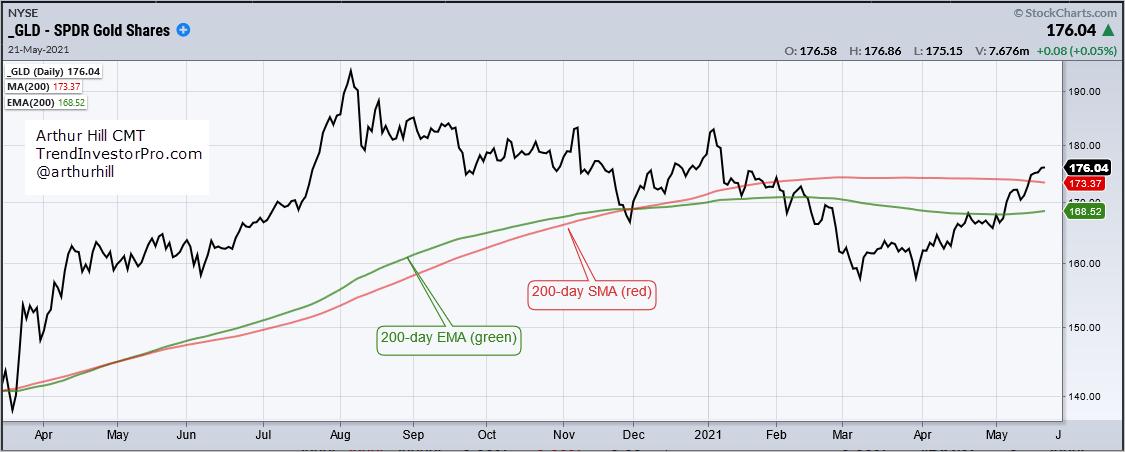
The Gold SPDR (GLD) crossed above its 200-day EMA in early May and its 200-day SMA this past week. Both signals are "bullish" and point to a long-term uptrend, but tell us little regarding realistic expectations going forward... Read More
Art's Charts May 19, 2021 at 08:47 AM
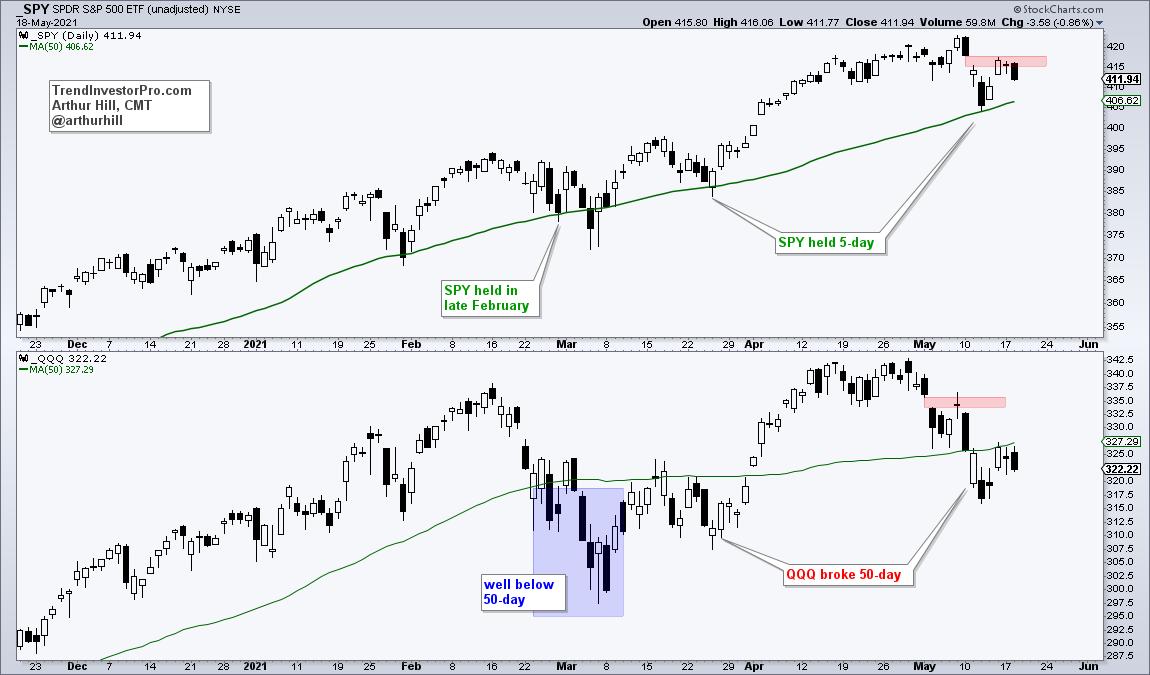
Chartists can compare performance by using the 50-day SMA as a benchmark level. Names that exceed their 50-day SMAs show more strength than those that do not exceed their 50-day SMAs. By this yardstick, QQQ is underperforming SPY and weighing on the broader market... Read More
Art's Charts May 11, 2021 at 08:40 AM
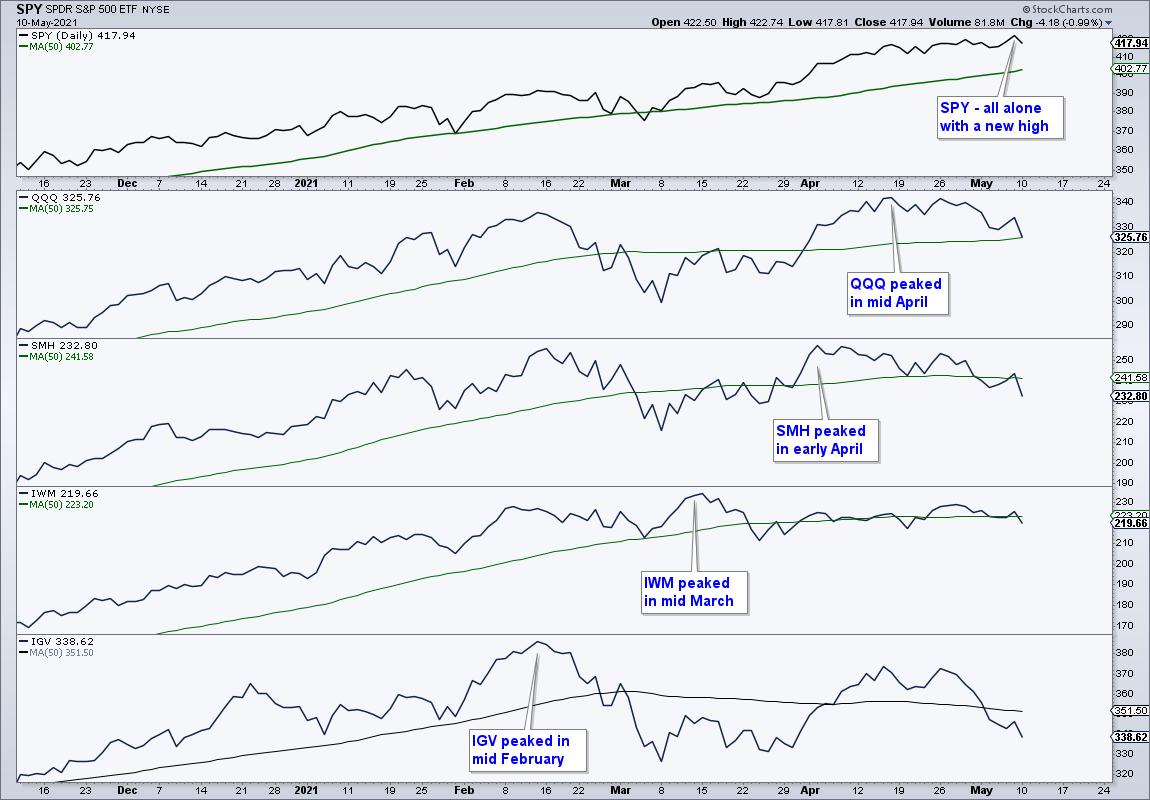
The S&P 500 SPDR hit a new high last week, but it was alone at the top because several other major index ETFs did not confirm. In fact, these non-confirmations have been building since March as fewer groups participated... Read More
Art's Charts May 09, 2021 at 07:10 AM
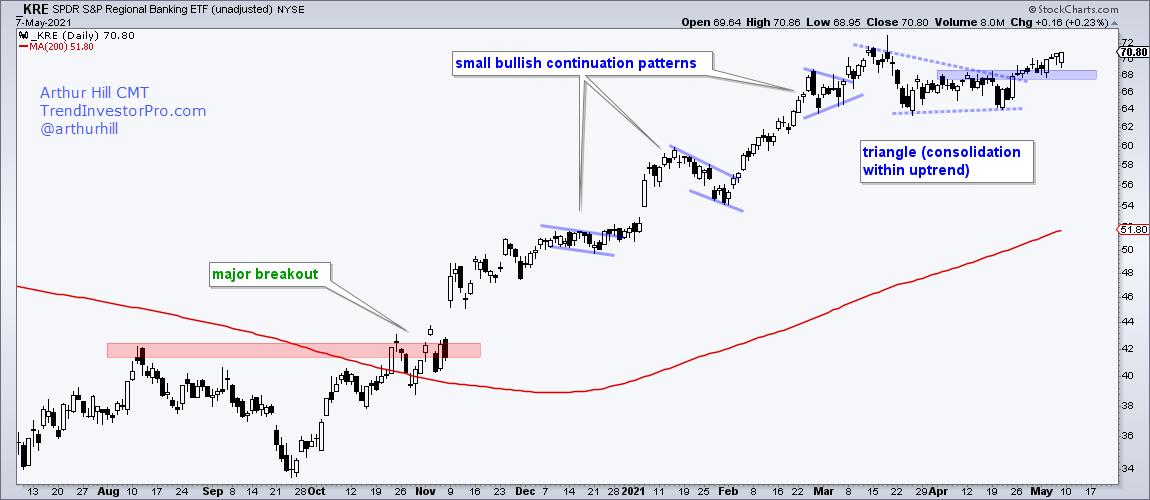
The Regional Bank ETF pattern over the last few months is similar to that of the S&P SmallCap 600 SPDR and Russell 2000 ETF. This is not surprising because the financial services sector accounts for 17.8% of IJR and 16.34% of IWM, and is the second biggest sector for both... Read More