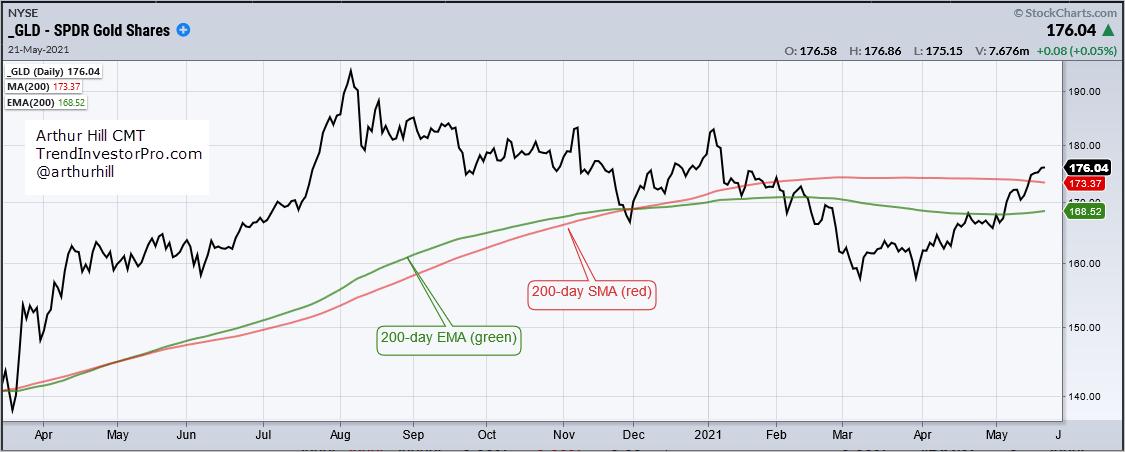
The Gold SPDR (GLD) crossed above its 200-day EMA in early May and its 200-day SMA this past week. Both signals are "bullish" and point to a long-term uptrend, but tell us little regarding realistic expectations going forward. To get a better understanding, we need to know which signal performs best, what are historic win rates and what is the average gain/loss? Among other things. Understanding some basic performance metrics can help us set realistic expectations going forward. This article will put these moving average signals to the test and show how to improve performance.
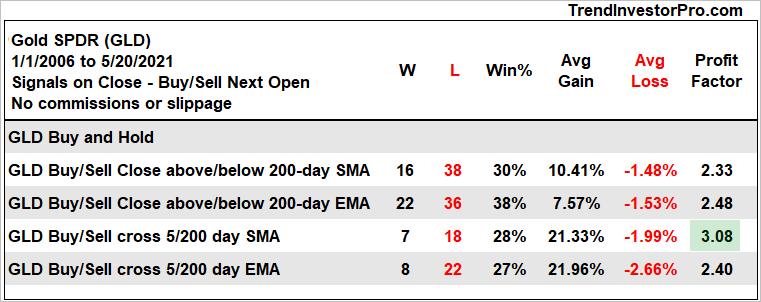
Past performance does not guarantee future performance, but we can get a better idea of what to expect by studying past signals. This, after all, is pretty much what technical analysis is all about. The table below shows performance when buying on a cross above the two moving averages and selling on a cross below since 2006. There were over 50 signals and quite a few whipsaws because the Win% is below 40% (percentage of winning trades). The EMA Win% is higher (38% vs 30%). The Average Gain was much larger for the SMA cross (10.41% vs 7.57%) and the Profit Factor was similar. I would call this a tie overall.
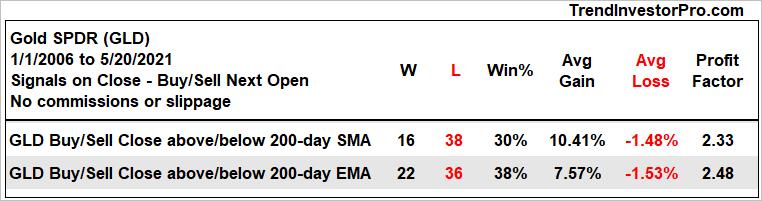
Profit Factor is the total Dollar profit divided by the total Dollar loss. This is the ex-post reward to risk ratio. A number greater than 2 means total profit was more than twice the total loss.
We can improve results by using a 5-day SMA or EMA instead of closing prices. In other words buy/sell when the 5-day SMA crosses above/below the 200-day SMA. The table below shows half as many signals, but the Win% fell below 30%. The low Win% was offset by a sharp increase in the Average Gain, which was above 21% for both the EMA and SMA cross. The 5/200 SMA cross performed the best overall because the Profit Factor was above 3.
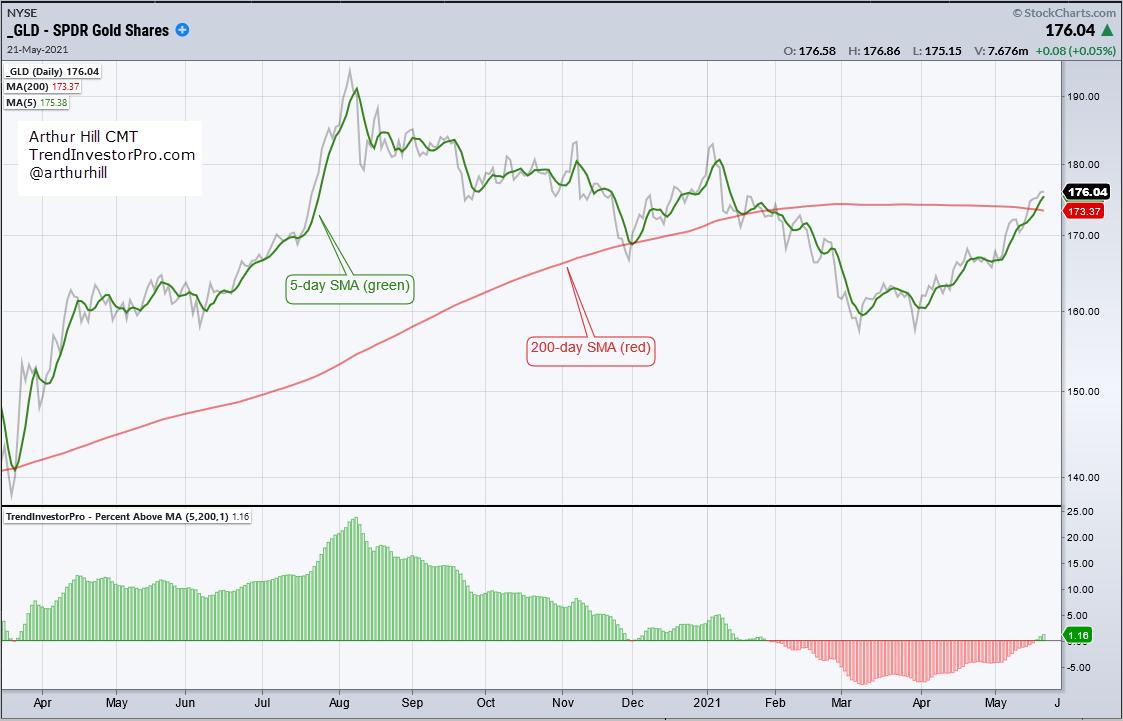
We can chart the difference between two SMAs using the TIP Indicator Edge Plugin for StockCharts ACP (click here for details). Note that you can plot the difference between two EMAs using the Percentage Price Oscillator (PPO). The chart below shows GLD with the 5-day SMA (green) and 200-day SMA (red). Percent Above MA (5,200,1) shows that the 5-day SMA is currently 1.16% above the 200-day SMA.
The 5/200 cross has a low Win%, but a good average gain and solid Profit Factor. Keep in mind that this is based on 25 completed trades over a 15 year period. These metrics can be improved using the Trend Composite, which is an indicator that aggregates signals from five trend indicators. We should also consider the overall structure of the price chart. In part 2, I put GLD and the Silver ETF (SLV) to the test using the Trend Composite, analyzed correlation and volatility, and examined the price charts for both (w/video). Click here to get immediate access to this report and all content at TrendInvestorPro.
-------------------------------------------------------------------
Choose a Strategy, Develop a Plan and Follow a Process
Arthur Hill, CMT
Chief Technical Strategist, TrendInvestorPro.com
Author, Define the Trend and Trade the Trend
Want to stay up to date with Arthur's latest market insights?
– Follow @ArthurHill on Twitter


