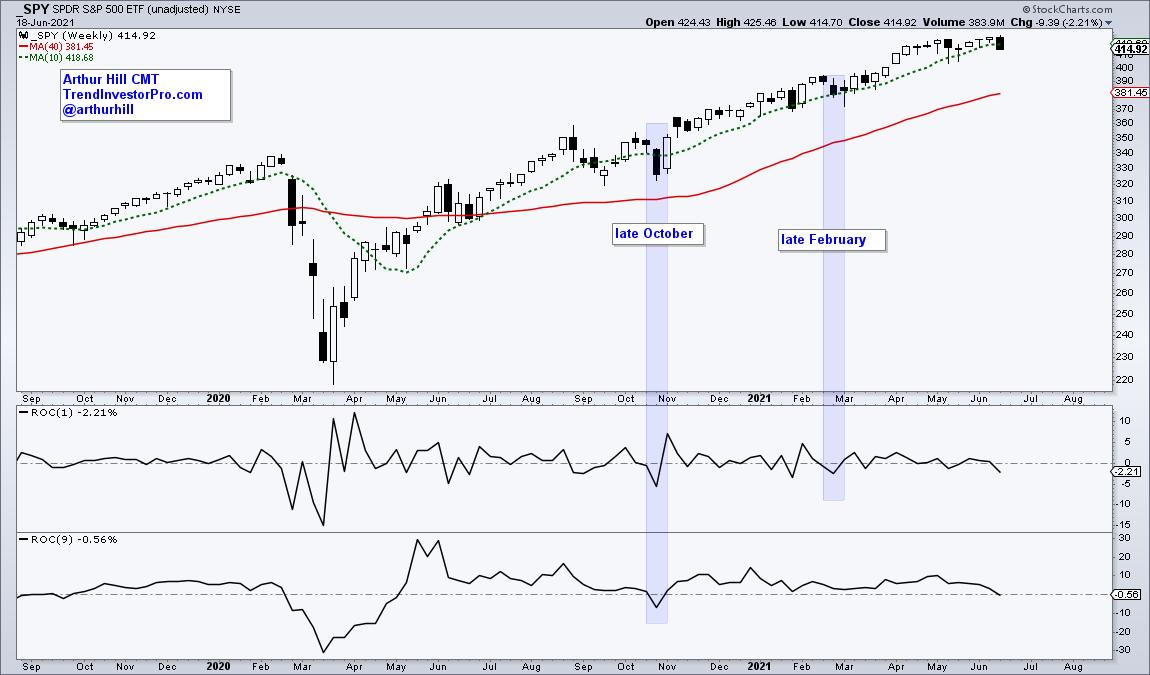
SPY experienced its biggest weekly decline (-2.2%) since late February and the nine-week Rate-of-Change turned negative for the first time since late October. The ETF also closed below its 10-day SMA for the first time since late January. Normally, a close or dip below the 10-week SMA signals a pullback within an uptrend and such pullbacks can provide short-term opportunities to partake in the long-term uptrend. However, medium-term breadth deteriorated significantly over the last few weeks and a corrective period could be upon us.
The next chart shows the S&P 500 in the top window and the percentage of stocks above the 50-day SMA in the lower window. The blue shading starts when %Above 50-day dips below 30%. Such dips show above average downside participation. Note that the dip in June 2019 foreshadowed a corrective period into September (four months), while the dip in late September 2020 foreshadowed a corrective period into late October (one month). On both occasions, $SPX formed triangle consolidations, which is a flat time-based correction, and the triangle breakouts ended the corrections.
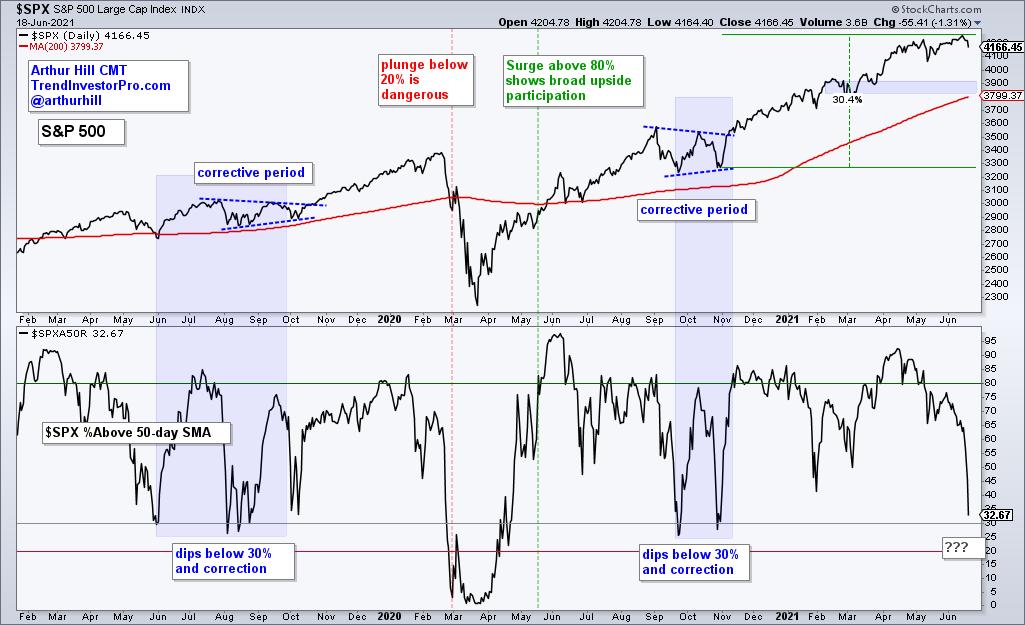
SPX %Above 50-day SMA is currently at 32.67% and has yet to exceed 30%, which means the official correction signal has yet to trigger. I am, however, concerned with the rapid deterioration in this indicator as it fell from 76% to 33% here in June. Also keep in mind that SPY advanced some 30% from its late October low and a correction at this stage would be perfectly normal, and even healthy. The blue zone marks a possible target in the 3800-390 area.
Interested in breadth indicators and charts? Get the Essential Breadth Indicator ChartList for free with your subscription to TrendInvestorPro.com. This list tracks dozens of breadth indicators with over 100 customized charts organized in a logical top-down manner. Click here to subscribe and take your charting skills to the next level!
--------------------------------------------------
Choose a Strategy, Develop a Plan and Follow a Process
Arthur Hill, CMT
Chief Technical Strategist, TrendInvestorPro.com
Author, Define the Trend and Trade the Trend
Want to stay up to date with Arthur's latest market insights?
– Follow @ArthurHill on Twitter


