RSI is a momentum oscillator that many chartists use to identify overbought and oversold levels. While RSI above 70 is typically considered an overbought condition, it is also a sign of strong upside momentum that can signal the start of an extended advance. Conversely, RSI below 30 is considered an oversold condition, but it is also a sign of strong downside momentum that can signal the start of an extended decline.
The Oil & Gas Exploration & Production ETF (XOP) provides a case in point. On the chart below, notice how RSI surged above 70 in late November and exceeded 70 again in January, February, March, and June. RSI did not come close to 30 on the pullbacks, which means chartists using 30 to spot short-term oversold conditions within the uptrend did not get any signals.
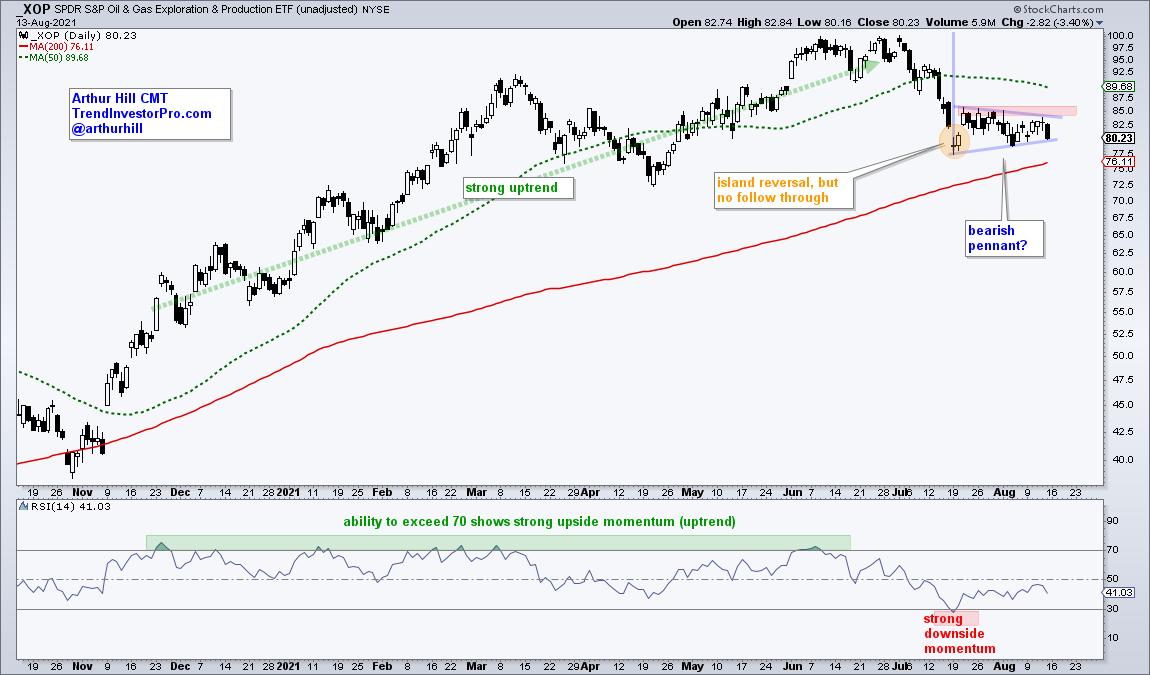
Conditions changed in mid July as downside momentum increased substantially and RSI dipped below 30. Prior RSI dips did not come close to 30 and this dip shows above-average downside momentum, which could signal a trend change. Short-term, XOP fell sharply and then forged an island reversal (yellow shading). There was NO follow though to this reversal attempt and a pennant formed the last few weeks (blue lines). This is a short-term bearish continuation pattern and a break below the pennant line would argue for further downside. A break above the red resistance zone would call for a re-evaluation.
Even though we are still in a bull market, junk bond spreads widened over the last few weeks and small-caps are seriously lagging. Today's commentary at TrendInvestorPro analyzed the junk bond spreads and some bearish setups in the Russell 2000 ETF, Russell Microcap ETF, Oil & Gas Exploration & Production ETF and Natural Gas ETF. Click here to take your analysis to the next level!
--------------------------------------------------
Choose a Strategy, Develop a Plan and Follow a Process
Arthur Hill, CMT
Chief Technical Strategist, TrendInvestorPro.com
Author, Define the Trend and Trade the Trend
Want to stay up to date with Arthur's latest market insights?
– Follow @ArthurHill on Twitter


