 Chartists often face a conundrum when a new trend signal triggers because the stock or ETF is frequently extended when this signal triggers. After all, it takes strong buying pressure for a new uptrend to signal. Short-term overbought or extended conditions are long-term bullish, but these same conditions can lead to a pullback.
This is when a trading strategy takes over. A true trend-follower is not scared off when a stock or ETF is overbought or extended. True trend-followers have a strategy with clearly defined rules for entry and exit. They swallow the overbought pill, buy when their rules say buy and sell when their rules say sell.
Traders will approach the trend signal differently. After all, traders are timers. They will prefer to wait for a pullback or short-term oversold condition before catching a ride. This is also a valid strategy and can even help trend-followers with their timing. Sometimes, however, it takes months for a pullback to materialize.
Let's take the Software ETF (IGV) as an example. StochClose turned bullish for IGV on 30-April-2020 and the ETF was up around 30% at the time. Despite a 30% gain in six weeks, the ETF continued higher the next few months and did not signal an oversold condition until August 11, over three months later. This is when RSI(14) dipped into the 40-50 zone, which I consider a mild oversold condition (blue rectangle). Oh, and IGV was up another 18% by the time RSI dipped below 50.
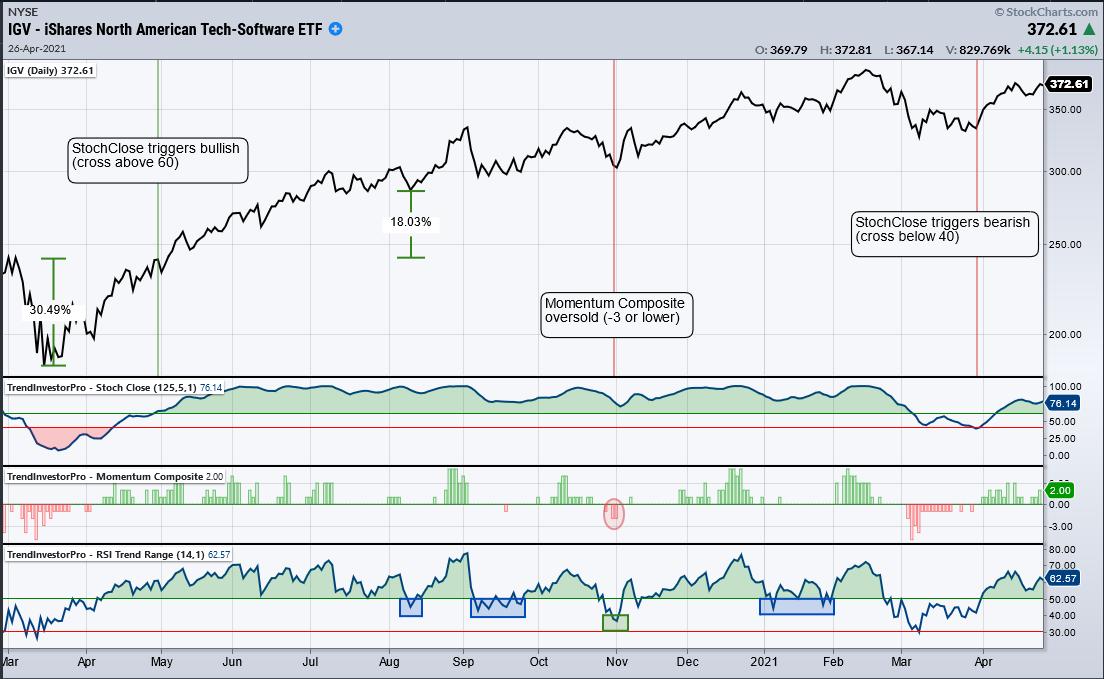
RSI went on to generate some more oversold readings in September and January (blue boxes). The green box in late October shows what I call a modest oversold condition, which is when RSI dips into the 30-40 zone. This is also when the Momentum Composite became oversold with a reading of -3. Either way, it was a rather long wait for the pullback. The indicators on the chart above are part of the TIP Indicator Edge Plugin.
Several ETFs triggered bullish StochClose signals over the last three weeks and I am tracking these trend signals at TrendInvestorPro.com. In addition, I expanded the subject of trend-following signals and timing pullbacks in commentaries on Thursday and Friday. Click here to take your charting to the next level.
*****************************
Choose a Strategy, Develop a Plan and Follow a Process
Arthur Hill, CMT
Chief Technical Strategist, TrendInvestorPro.com
Author, Define the Trend and Trade the Trend
Want to stay up to date with Arthur's latest market insights?
– Follow @ArthurHill on Twitter


