 It's been a rough year for much of the market, but the Metals & Mining SPDR (XME) is bucking the selling pressure as it challenges its 2021 highs and the price relative breaks out. There is also a big bullish continuation pattern at work. Note that 40% of XME components are in the steel group and 14% in aluminum.
The chart below shows XME more than doubling from late September to late May and then embarking on a long consolidation. And I do mean long. The ETF traded flat for over six months and most trend indicators whipsawed in the process, including the Trend Composite.
Despite these whipsaws, the overall structure of the chart is bullish. A consolidation after a big advance is typically a bullish continuation pattern. The consolidation works off overextended conditions and digests big gains. It is the pause that refreshes.
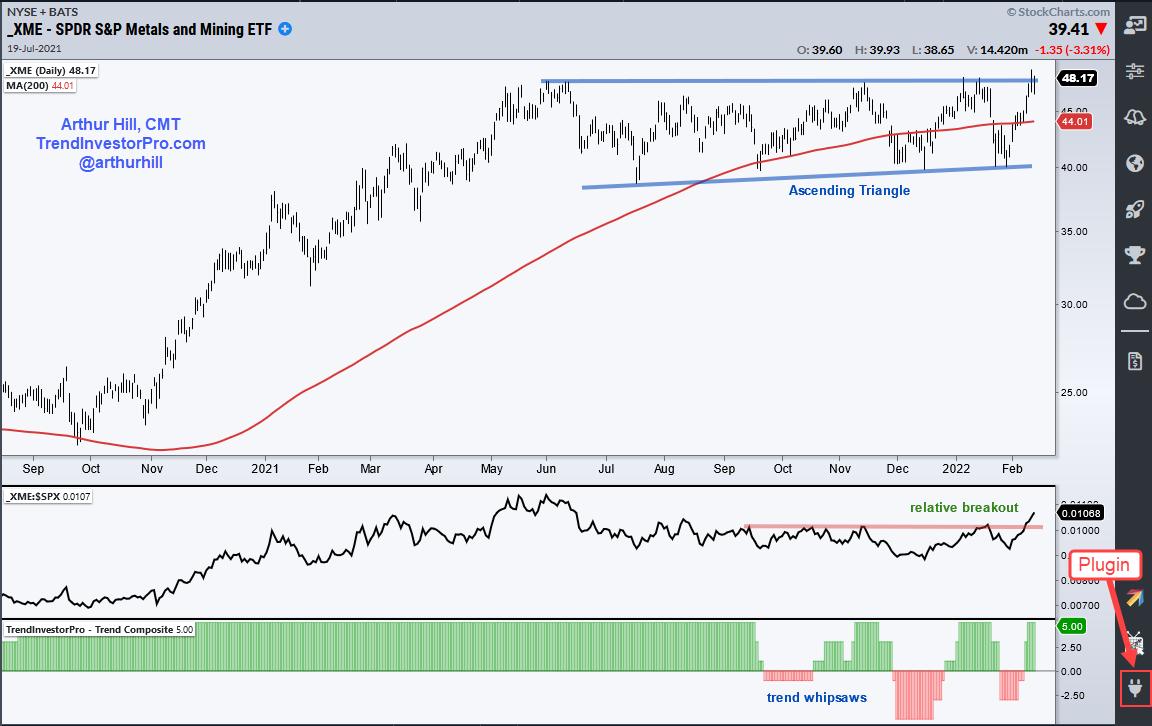
There is also a slight rise in the lower trendline and the pattern looks like an Ascending Triangle, which is a bullish continuation pattern. A breakout would signal an end to this consolidation and a resumption of the prior advance.
The middle window shows the XME:SPY ratio rising into May as XME outperformed and falling into mid December as XME underperformed. Notice that the ratio broke out here in February and this means XME is outperforming in 2022.
The bottom window shows the Trend Composite whipsawing from September to January. The indicator flipped back to bullish on February 8th. Trend indicators catch good trends, but they are also prone to whipsaws. It is just something we must live with. For now, XME looks poised to break out on the price chart, the ETF shows relative strength and the Trend Composite is on the same page.
The Trend Composite is one of 11 indicators in the TrendInvestorPro Indicator Edge Plugin for StockCharts ACP. Other indicators include the Momentum Composite and ATR Trailing Stop. Click here to learn more.
This month we started a multi-part series on a Trend Composite Strategy at TrendInvestorPro. Part 1 covers the indicators and the methodology. Part 2 puts the indicator to the test with 97 ETFs. Next week we will run portfolio level tests and this series will continue for the next several weeks. Click here for more information on TrendInvestorPro.
-----------------------------------------------------------------------
Choose a Strategy, Develop a Plan and Follow a Process
Arthur Hill, CMT
Chief Technical Strategist, TrendInvestorPro.com
Author, Define the Trend and Trade the Trend
Want to stay up to date with Arthur's latest market insights?
– Follow @ArthurHill on Twitter


