 The SPDR S&P 500 exchange-traded fund (SPY) surged from mid-October to early December, but this advance was considered a counter-trend bounce within a bigger downtrend. And this week, SPY reversed its short-term uptrend and the bearish technical setup was similar to the last two reversals.
First and foremost, the long-term trend is down and has been down since mid-April, if not earlier. SPY forged lower lows in March and June, and then 52-week lows in late September and mid-October. The red dashed line shows lower highs since March and the ETF has been below its falling 200-day simple moving average (SMA) for most of the last eight months. I quantified 200-day SMA signals in my article two weeks ago and showed how to improve performance.
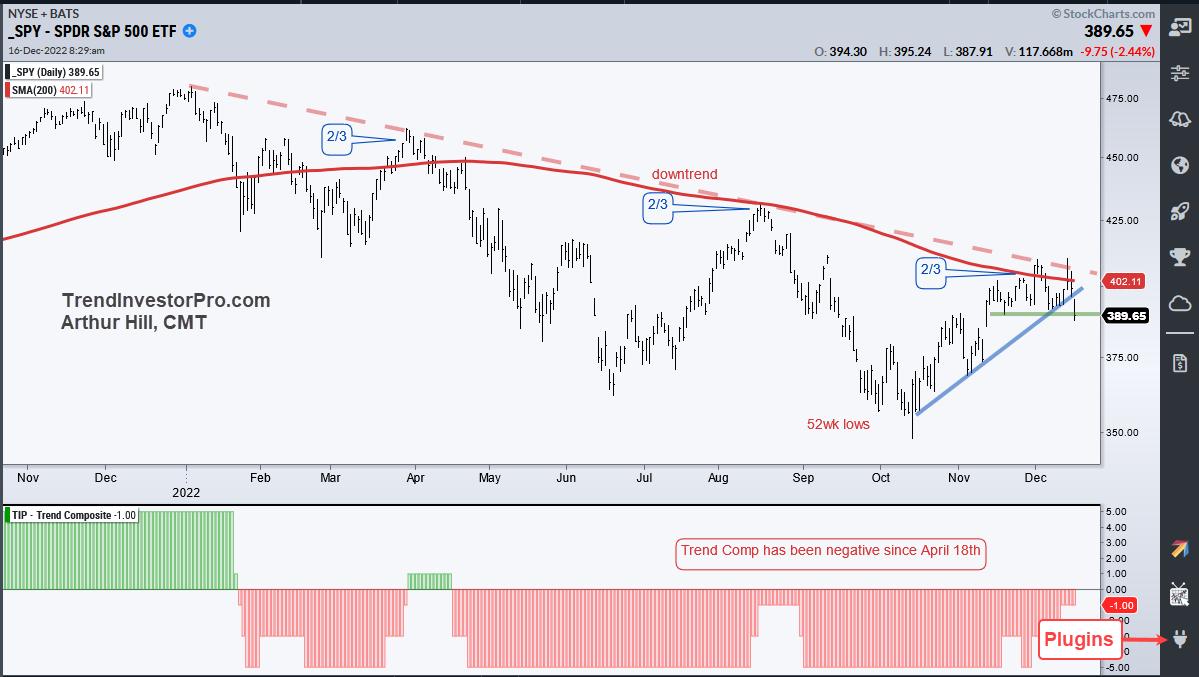
CHART 1: ARE WE SEEING A BEAR MARKET BOUNCE? Given that SPY hasn't broken above its August high, a continuation of the larger downtrend is possible. Chart source: StockChartsACP from StockCharts.com. For illustrative purposes only.
The October–December advance seemed strong, but a little context showed it to be a bear market bounce. Notice that this advance retraced around 2/3 of the prior decline and SPY reversed the short-term uptrend with a sharp decline the last two days. The March–April and June–August counter-trend bounces also retraced around 2/3 of the prior decline before reversing (see the 2/3 markers in the chart above). This is not a coincidence. Charles Dow notes that secondary advances often retrace one-to-two thirds of their prior declines with 50% being the base case. Think of it as two steps down and one step up.
A downtrend remains in force as long as lower lows and lower highs persist (two down, one up). SPY hit a 52-week low in October, which was a lower low. The current advance fell short of the August high so we have yet to see a higher high. This week's short-term support break and trend reversal signal a continuation of the bigger downtrend and I expect a test of the fall lows, at the very least. My only concern is that this seems to be the consensus opinion! In any case, the chart is bearish until proven otherwise.
TrendInvestorPro was monitoring this counter-trend bounce as SPY entered the resistance-reversal zone. A short-term breadth indicator triggered bearish on December 6 for the early warning and Thursday's support break confirms this signal. We are also watching counter-trend move ETFs related to semiconductors, retail, and industrials, as well as the breakdowns in ETFs related to small-caps, financials, and banks. Click here for immediate access to our weekly reports and videos.
The Trend Composite, Momentum Composite, ATR Trailing Stop, and eight other indicators are part of the TrendInvestorPro Indicator Edge Plugin for StockCharts ACP. Click here to learn more and take your analysis process to the next level.
---------------------------------------
Choose a Strategy, Develop a Plan and Follow a Process
Arthur Hill, CMT
Chief Technical Strategist, TrendInvestorPro.com
Author, Define the Trend and Trade the Trend
Want to stay up to date with Arthur's latest market insights?
– Follow @ArthurHill on Twitter


