 The S&P 500 Index ($SPX) crossed its 200-day simple moving average (SMA) for the 173rd time since 2000 and the performance for this "signal" is not that great. Buying and selling the 200-day SMA cross produced a lower return than buy and hold. This cross, however, did manage to curtail the drawdowns. Chartists can improve performance by taking it a little slower and adding a signal filter. We will look at some chart signals first and then quantify performance for these signals.
The chart below shows the $SPX with crosses of the 200-day SMA highlighted in blue. The indicator window shows the percentage difference between the close and the 200-day SMA. The indicator turns green with a close above the 200-day SMA and red with a close below it. So far this year $SPX crossed the 200-day SMA twelve times. And there were 22 crosses since 2020. Talk about whiplash.
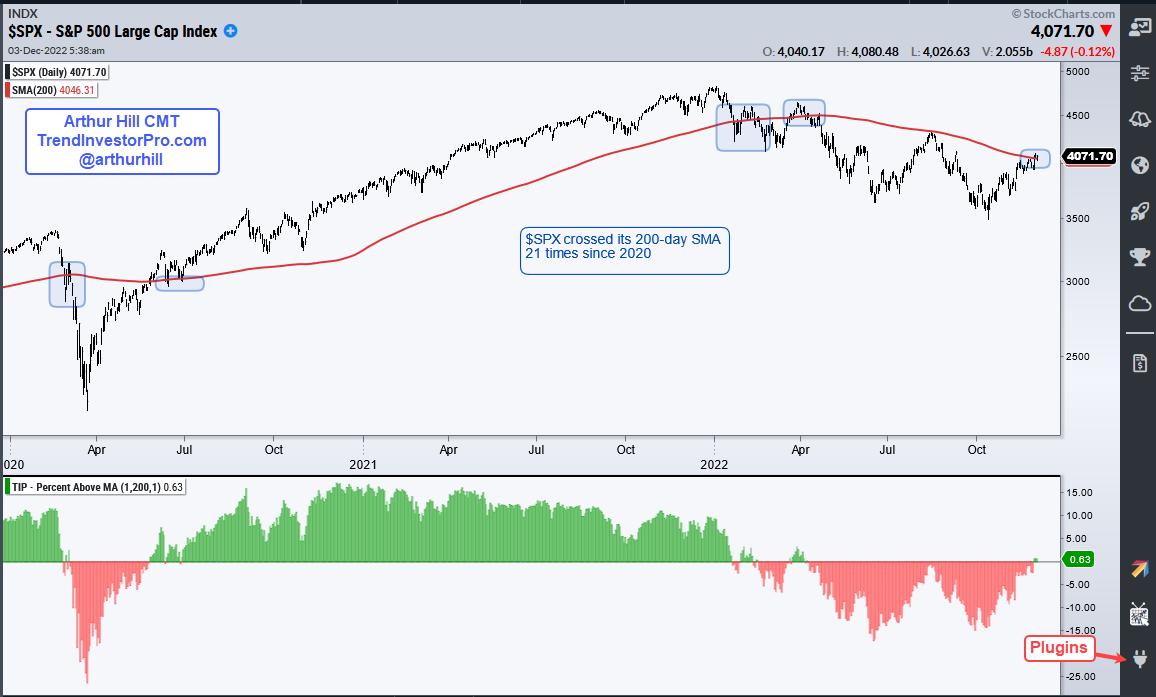
CHART 1: 200-DAY SMA CROSSES IN THE S&P 500 INDEX ($SPX). Here you see how many times $SPX crossed the 200-day SMA (blue highlights). The indicator below turns green when $SPX is above the 200-day SMA and red when $SPX is below the 200-day SMA. Chart source: StockChartsACP from StockCharts.com. For illustrative purposes only.
Chartists, and cowboys, can improve performance by slowing down a little and smoothing the close with a five-day SMA. The next chart shows the five-day SMA in green and the 200-day SMA in red. Note that the five-day SMA crossed the 200-day SMA just seven times since 2020. Five crosses occurred this year, which shows just how noisy it's been in 2022.
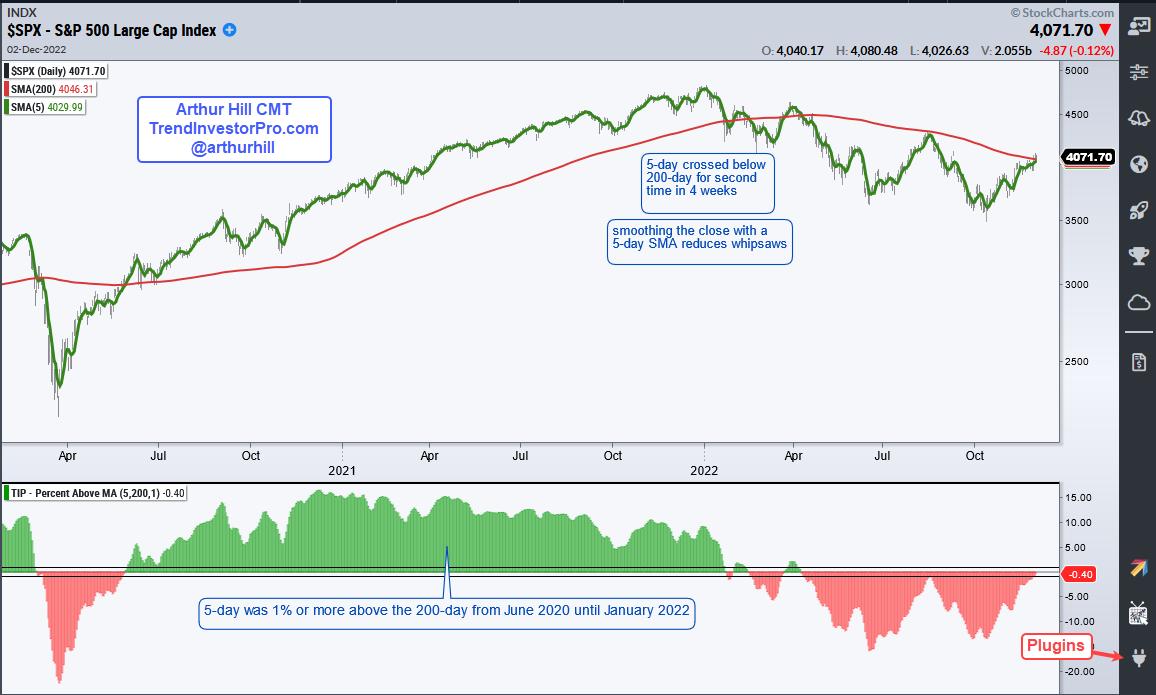
CHART 2: FIVE-DAY SMA AND 200-DAY SMA CROSSOVERS. There were five crosses this year, which is an indication of how noisy the stock markets have been this year. Chart source: StockChartsACP from StockCharts.com. For illustrative purposes only.
The indicator window shows the percentage difference between the 5- and 200-day SMAs, and the crosses. Notice that I added lines at +1% and -1% as a signal filter. A bull signal triggers when the five-day is at least 1% above the 200-day and a bear signal triggers when the five-day is at least 1% below the 200-day. This filter further reduced whipsaws and improved performance. This indicator is part of the TIP Indicator Edge plug-in for StockChartsACP.
Backtesting Results
Now let's quantify these signals. The table below shows backtest results for buy-and-hold, the 200-day SMA cross, 5/200 day cross, and the 5/200 day cross with a 1% filter. Buy-and-hold produced a compound annual return (CAR) of 4.54% since 2000 and the average drawdown was 37%. The drawdown is the decline from peak to trough in portfolio equity.
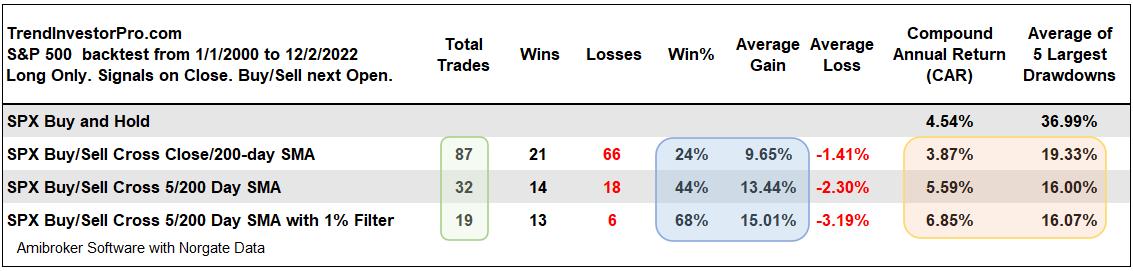
CHART 3: BACKTESTING RESULTS. Smoothing the close with a five-day SMA and adding a 1% signal filter reduced the whipsaws which can better help with broad market timing. Source: Amibroker. Data source: Norgate Data. For illustrative purposes only.
Notice that the number of trades decreased as I smoothed the close with a five-day SMA and then added a 1% signal filter (blue shading). Each step increased the win% and average gain. The CAR for the 200-day cross (3.87%) was lower than buy-and-hold because of all the whipsaws. The 5/200 SMA cross outperformed buy-and-hold with a lower average drawdown and the 1% filter increased the return with a small increase in the drawdown (orang shading).
The Takeaway
Not so fast with crosses of the 200-day SMA. Take a step back by smoothing the close with a five-day SMA and adding a 1% filter for signals. This won't necessarily eliminate whispsaws but it will reduce them and help with broad market timing. The S&P 500 Index provides an important clue to the overall health of the stock market and we should pay attention.
TrendInvestorPro tracks Trend Composite signals for the 274 ETFs in our MasterList and ranks these ETFs according to price performance. Our reports and videos highlight chart setups with dozens of ETFs featured each week. Click here for immediate access.
The Trend Composite, Momentum Composite, ATR Trailing Stop and eight other indicators are part of the TrendInvestorPro Indicator Edge Plugin for StockCharts ACP. Click here to learn more and take your analysis process to the next level.
---------------------------------------
Choose a Strategy, Develop a Plan and Follow a Process
Arthur Hill, CMT
Chief Technical Strategist, TrendInvestorPro.com
Author, Define the Trend and Trade the Trend
Want to stay up to date with Arthur's latest market insights?
– Follow @ArthurHill on Twitter


