
Art's ChartsOctober 12, 2024 at 04:10 AM
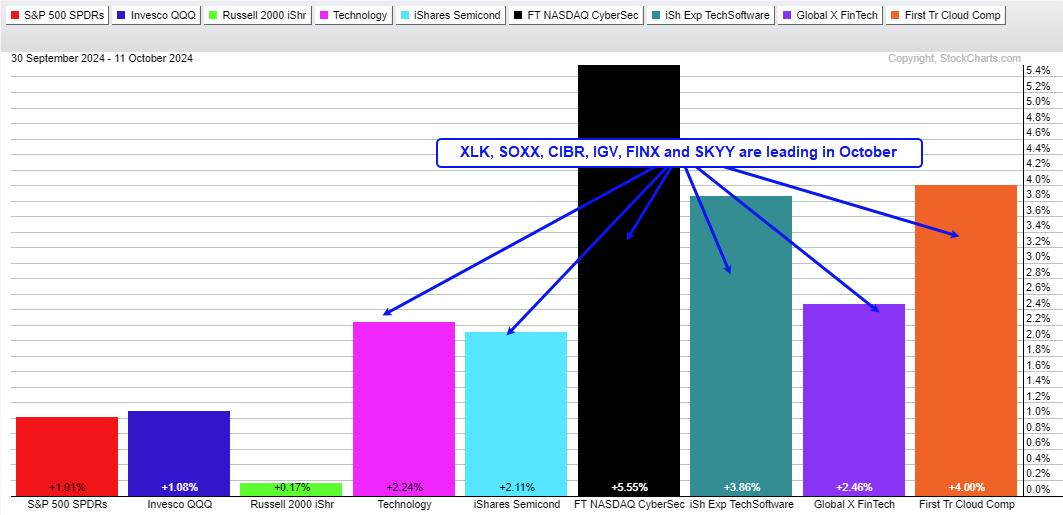
The Cybersecurity ETF (CIBR) is resuming the lead as it surged to new highs this past week. It is important to note that CIBR began its leadership role a lot earlier because it hit a new high in late August...Read More
Art's ChartsOctober 04, 2024 at 05:37 PM
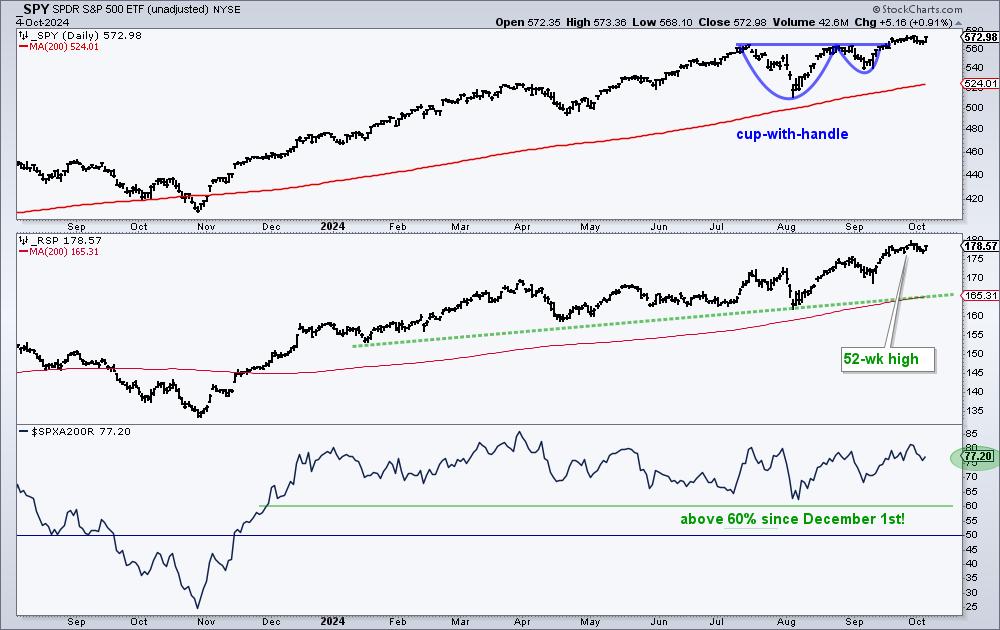
It is a bull market for stocks. On the chart below, the S&P 500 SPDR (SPY) recently broke rim resistance of a cup-with-handle pattern and is trading near a 52-week high...Read More
Art's ChartsSeptember 14, 2024 at 03:18 AM

Whipsaws and losing trades are part of the process for trend-following strategies. These are expenses, and simply unavoidable. Over time, trend-following strategies will catch a few big trends and these profits will more than cover the expenses...Read More
Art's ChartsSeptember 09, 2024 at 10:15 AM

Any strategy that trades stocks needs some sort of market timing mechanism to identify bull and bear markets. Typically, stock strategies are fully invested during bull markets because risk is acceptable. Strategies move to cash during bear markets because risk is above average...Read More
Art's ChartsSeptember 02, 2024 at 09:12 AM

Extended trends often start with big bangs and major breakouts. Chartists can identify "big bang" moves by showing price change in ATR terms. We can use the price charts to identify big breakouts. Today's example will show Paypal (PYPL), which is part the FinTech ETF (FINX)...Read More
Art's ChartsAugust 24, 2024 at 06:56 AM
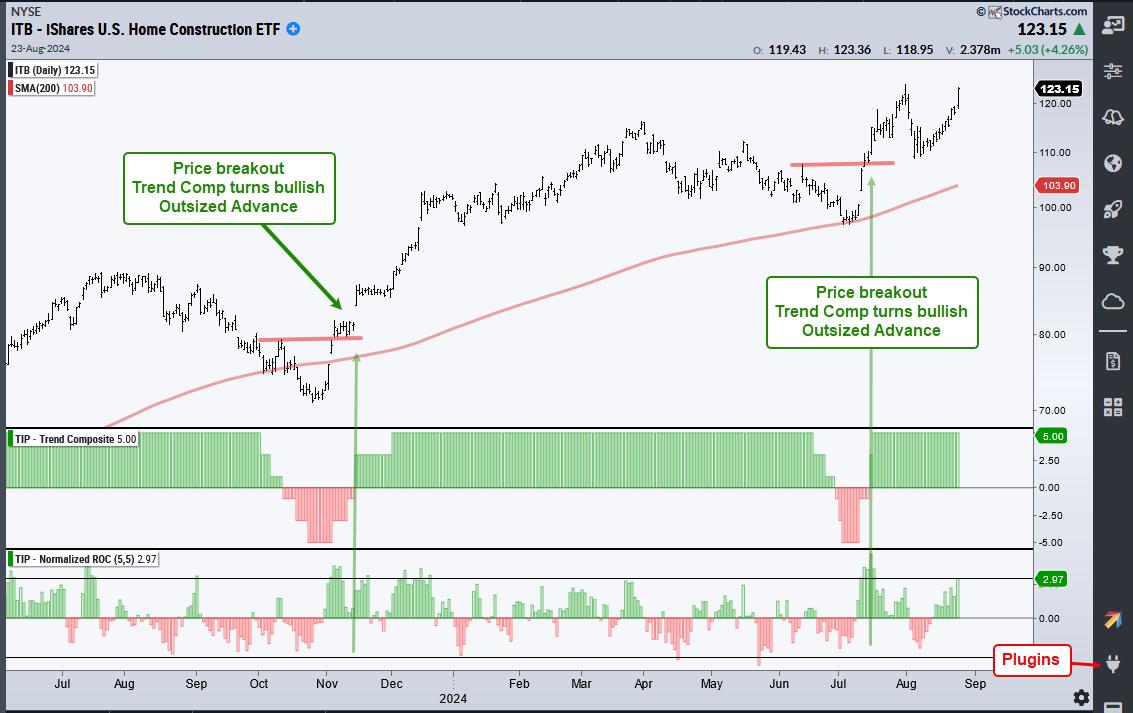
The Home Construction ETF (ITB) is leading the market as it surged to a new closing high this week. While this high is certainly bullish and points to upside leadership, the real signal triggered back in early July as the Trend Composite turned bullish with an outsized move...Read More
Art's ChartsAugust 09, 2024 at 10:51 AM
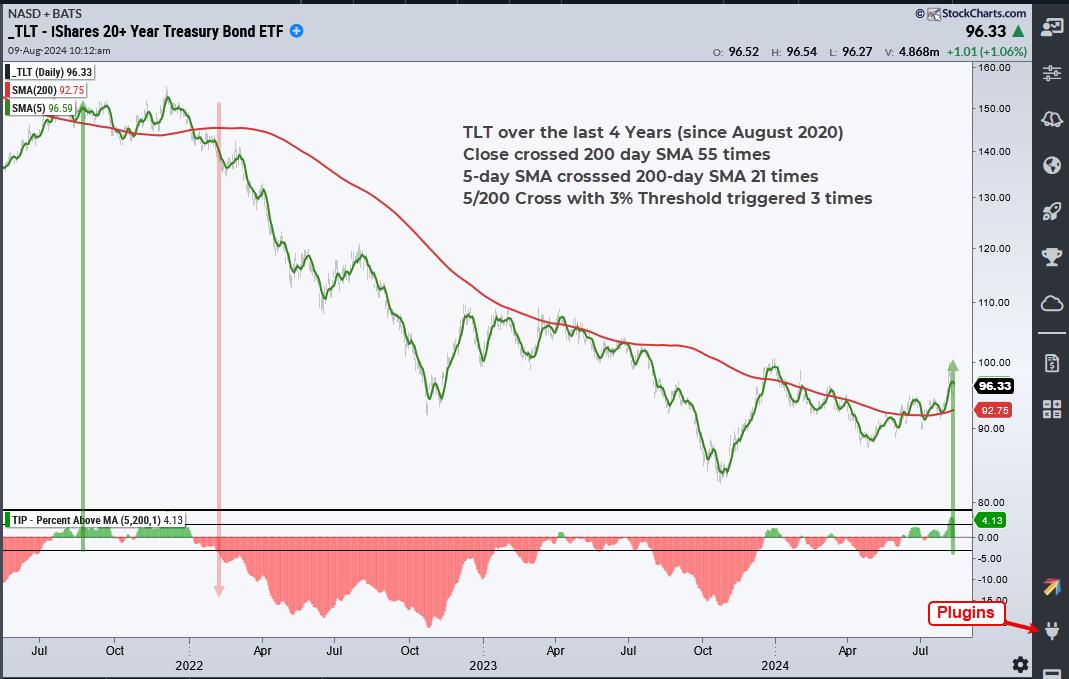
The 20+ Yr Treasury Bond ETF (TLT) is turning the corner as a long-term trend indicator turns bullish and price extends on a breakout. TLT is also starting to outperform the S&P 500 EW ETF (RSP), for the first time in a long time...Read More
Art's ChartsAugust 02, 2024 at 06:32 AM

The broad market and the group are big drivers for stock performance. Recently, the Nasdaq 100 ETF (QQQ) led the market lower with sizable declines over the last five weeks...Read More
Art's ChartsJuly 26, 2024 at 07:53 AM
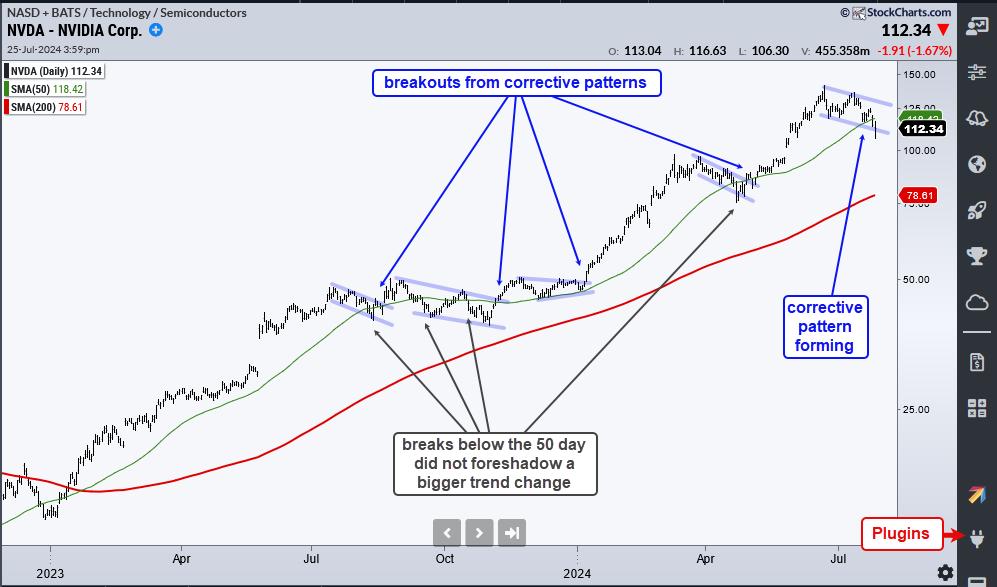
After a big run this year, Nvidia (NVDA) fell over 15% from its high and broke its 50-day simple moving average (SMA). On the face of it, a break below this "key" moving average seems like a short-term bearish signal...Read More
Art's ChartsJuly 19, 2024 at 04:18 AM
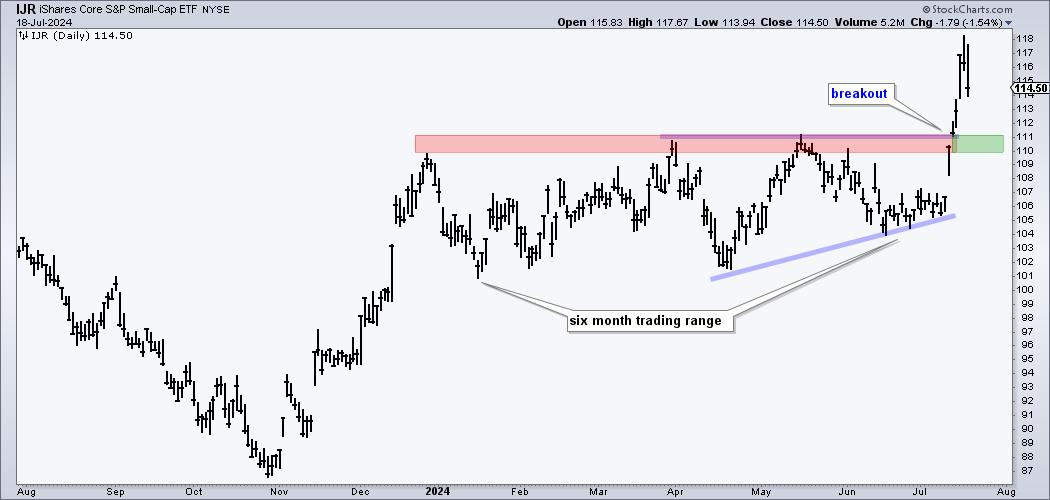
Small-caps took the lead over the last two weeks with the S&P SmallCap 600 SPDR (IJR) surging over 10% in five days and hitting a new high. IJR also broke out of a long consolidation and this breakout is bullish. There are now three possibilities going forward...Read More