
Art's ChartsJanuary 11, 2025 at 08:36 AM

The stock market is in pullback mode with the S&P 500 EW ETF down 5.15% over the past month and down 1% year-to-date. This makes it a good time to monitor relative performance and create a relative strength watch list...Read More
Art's ChartsJanuary 04, 2025 at 06:32 AM

The Russell 2000 ETF managed a double-digit gain in 2024, but did it the hard way with several deep pullbacks. Pullbacks within uptrends are opportunities and we can find such opportunities using %B. The chart below shows the Russell 2000 ETF (IWM) with the Zigzag(8) indicator...Read More
Art's ChartsDecember 26, 2024 at 10:11 AM

Breadth became oversold last week and stocks rebounded this week. Is this a robust rebound or a dead cat bounce? Today's report will show a key short-term breadth indicator hitting its lowest level in 2024 and becoming oversold...Read More
Art's ChartsDecember 20, 2024 at 09:10 AM
SPY and QQQ remain in long-term uptrends, but three big negatives are currently hanging over the stock market. Two negatives are tied to important cyclical groups and the third is reminiscent of summer 2022...Read More
Art's ChartsDecember 07, 2024 at 06:41 AM

Chartists looking for stock setups can start with strong industry groups. The Fintech (FINX) is in a strong uptrend and leading, but looking extended short-term. While there is no setup currently, we can learn from past setups and apply these lessons to stocks within the group...Read More
Art's ChartsNovember 27, 2024 at 09:32 AM

The 10-yr Treasury Yield reversed its upswing with a sharp decline and the Home Construction ETF (ITB) reacted with a noteworthy gap-surge. Today's report analyzes the yield, the TBond ETF (IEF) and ITB...Read More
Art's ChartsNovember 22, 2024 at 01:47 PM
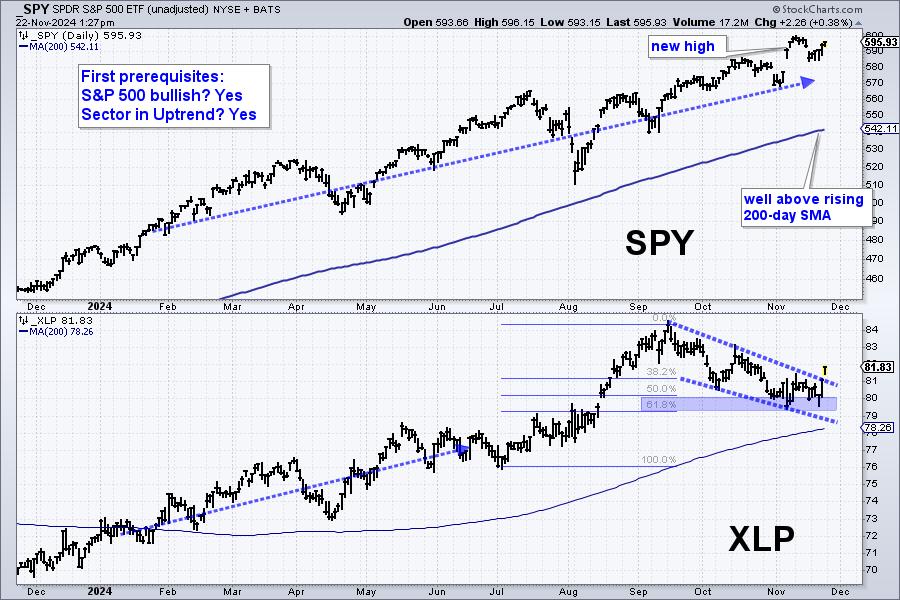
Even though trading based on chart analysis involves some discretionary decisions, chartists can improve the odds of success by systematizing their process. This report will show four prerequisite filters based on a top-down approach...Read More
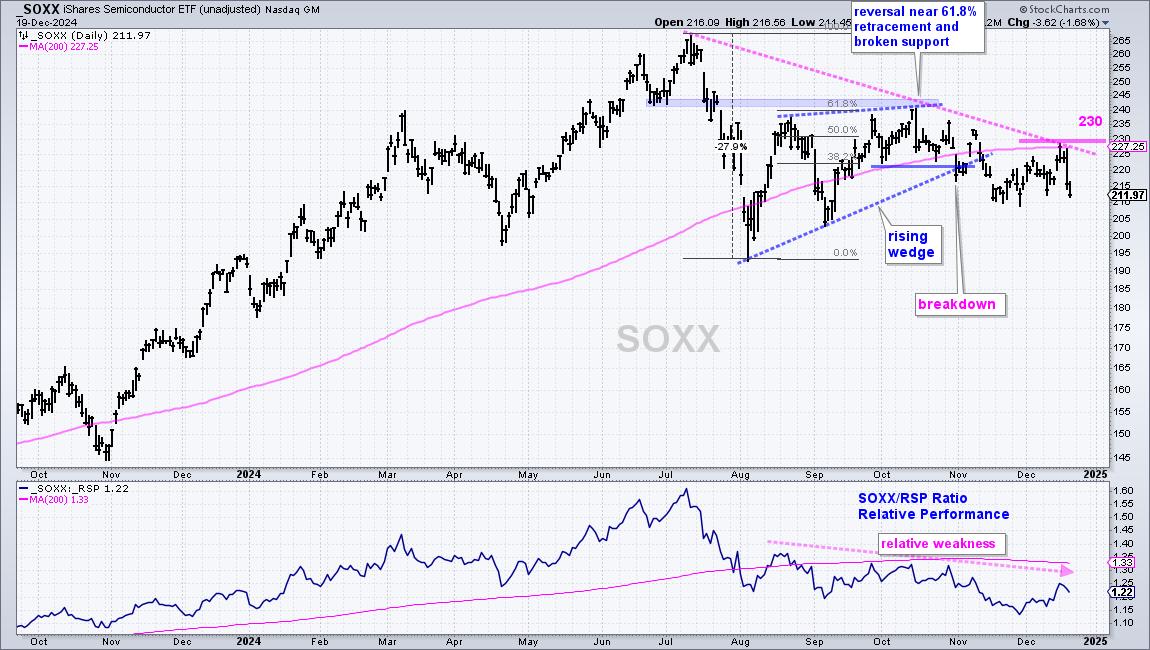
Art's ChartsNovember 19, 2024 at 08:15 AM
Even though the iShares Semiconductor ETF (SMH) and the VanEck Semiconductor ETF (SOXX) have many similarities, there are some big differences in their component weightings and performance. Namely, SMH allows more concentration than SOXX and SMH is holding up better than SOXX...Read More
Art's ChartsNovember 04, 2024 at 07:09 AM
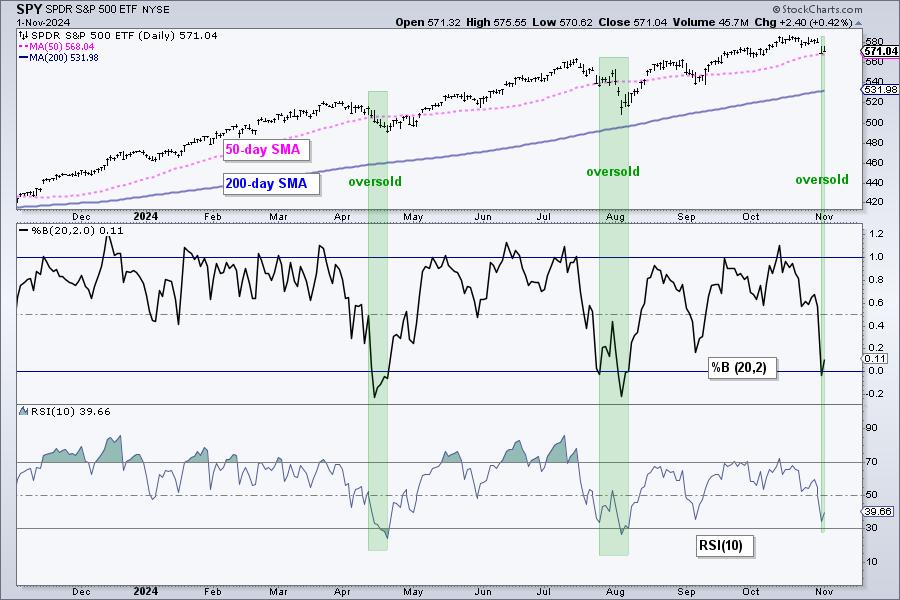
There is only one way to trade in a long-term uptrend: long. Forget about picking tops and breaks below short-term moving averages. Leaning bearish within a long-term uptrend is not a profitable strategy...Read More
Art's ChartsOctober 26, 2024 at 09:36 AM

There are no magic bullets, but we can improve our trading edge by starting our selection process with two proven concepts: trend and momentum. These are perhaps the two most powerful forces in the market...Read More