
Art's ChartsJuly 15, 2024 at 10:34 AM
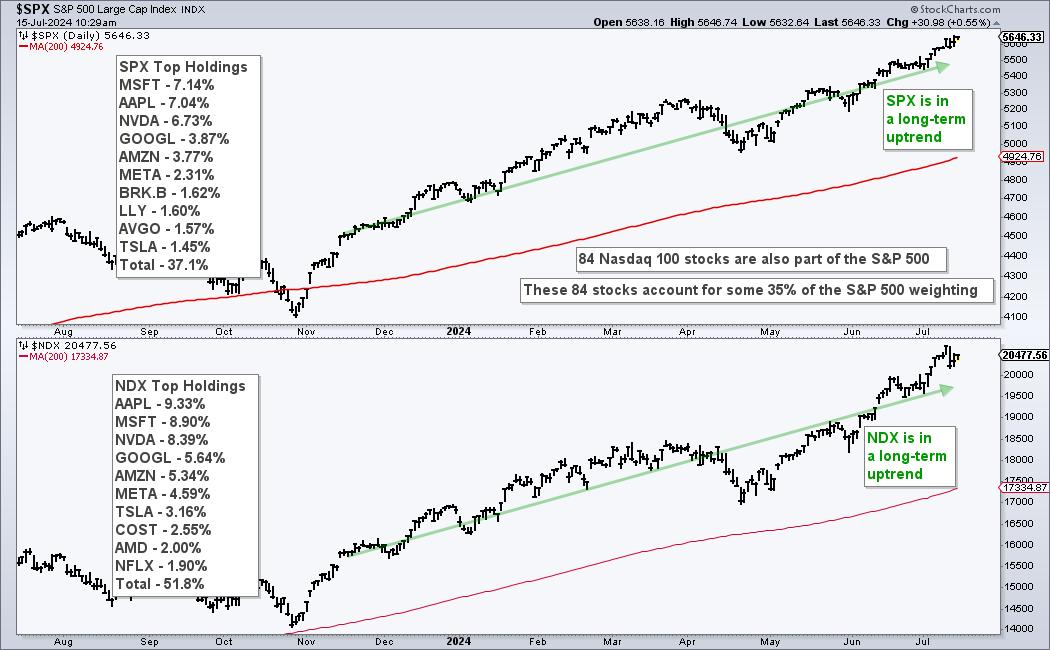
The Nasdaq 100 is a major driver in the stock market and Nasdaq 100 breadth indicators should be part of our broad market analysis routine. 84 Nasdaq 100 stocks (16.8%) are also in the S&P 500 and their weighting accounts for over 30% of the S&P 500...Read More
Art's ChartsJune 15, 2024 at 06:35 AM

The broader market is fairly mixed with one clear leader: technology. I am also seeing mixed performance within the technology sector and within specific groups. Semiconductors are strong overall, but groups like cybersecurity are more mixed. This makes it a stock pickers market...Read More
Art's ChartsJune 08, 2024 at 06:32 AM

Chinese stocks wet on a tear from mid April to mid May with the China Large-Cap ETF (FXI) gaining some 40% and breaking its 200-day SMA. FXI then fell back over the last few weeks...Read More
Art's ChartsJune 03, 2024 at 08:14 AM

As the name suggests, Dual Momentum Rotation Strategies focus on stocks that are in absolute and relative uptrends. This is a two-step process. First, filter out stocks that are in long-term downtrends and only focus on stocks in uptrend...Read More
Art's ChartsMay 17, 2024 at 12:38 PM

There is a certain ebb and flow in uptrends. Often we see some sort of stair step higher with big advances and smaller corrections along the way. In Dow Theory terms, the primary trend is up and declines within a primary uptrends are considered secondary price moves...Read More
Art's ChartsMay 10, 2024 at 12:10 PM

After sharp declines into mid April, stocks rebounded over the last three weeks and the S&P 500 SPDR (SPY) came within 1% of its March high. This March high acts as a benchmark high that chartists can use to compare performance...Read More
Art's ChartsMay 03, 2024 at 05:27 PM
Stocks fell sharply into late April and then rebounded over the last two weeks. SPY fell 5.34% from March 28th to April 19th and then rebounded with a 3.26% gain the last two weeks...Read More
Art's ChartsApril 20, 2024 at 06:18 AM

The S&P 500 is down 5.5% this month and volatility is rearing its ugly head. This is a good time to get some perspective by putting the move into context. My goal is to see the forest, as opposed to a few trees...Read More
Art's ChartsApril 12, 2024 at 05:22 PM
Trends often start with outsized moves. But how do we measure and identify such moves? Chartists can measure moves in Average True Range (ATR) terms using the ATR Trailing Stop SAR indicator (ATR-SAR). ATR is a volatility indicator developed by Welles Wilder...Read More
Art's ChartsMarch 30, 2024 at 09:39 AM
Momentum and trend strategies are off to a roaring start here in 2024. More often than not, these strategies buy leading stocks that appear overbought...Read More