
Art's ChartsJanuary 13, 2024 at 05:30 AM

Chartists looking to increase their odds should consider two timeframes for their analysis. The longer timeframe sets the strategic tone, while the shorter timeframe defines the trading tactics. Strategically, I am interested in stocks with long-term uptrends...Read More
Art's ChartsJanuary 08, 2024 at 08:40 AM

Mean-reversion strategies typically buy stocks when they are oversold, which means catching the falling knife. These declines are often rather sharp, but the odds favor some sort of bounce after reaching an oversold extreme...Read More
Art's ChartsJanuary 06, 2024 at 09:59 AM

Tech stocks were hit with selling pressure to start the year, but many are still in long-term trends and some are nearing support-reversal zones. In particular, Apple (AAPL) fell to a support-reversal zone and I am on alert for a bounce. Let's investigate...Read More
Art's ChartsDecember 15, 2023 at 11:08 AM

Stocks went on a tear the last seven weeks with Nasdaq 100 stocks leading the charge...Read More
Art's ChartsDecember 09, 2023 at 11:12 AM

The S&P 500 SPDR (SPY) surged over 10% since late October and exceeded the upper Bollinger Band (125,1). This means price is more than 1 standard deviation above the 125-day SMA. Surely, this means SPY is overbought...Read More
Art's ChartsNovember 26, 2023 at 11:21 AM

The percentage of stocks in long-term uptrends rebounded sharply in November and returned to the highs from late August and early September. This rebound is impressive, but the absolute levels are still not that inspiring...Read More
Art's ChartsNovember 18, 2023 at 04:45 PM
StockCharts users can chart the Zweig Breadth Thrust for the S&P 1500 or any other index that has Advance-Decline Percent data. All we have to do its convert the Zweig Breadth Thrust levels to their equivalents using Advance-Decline Percent...Read More
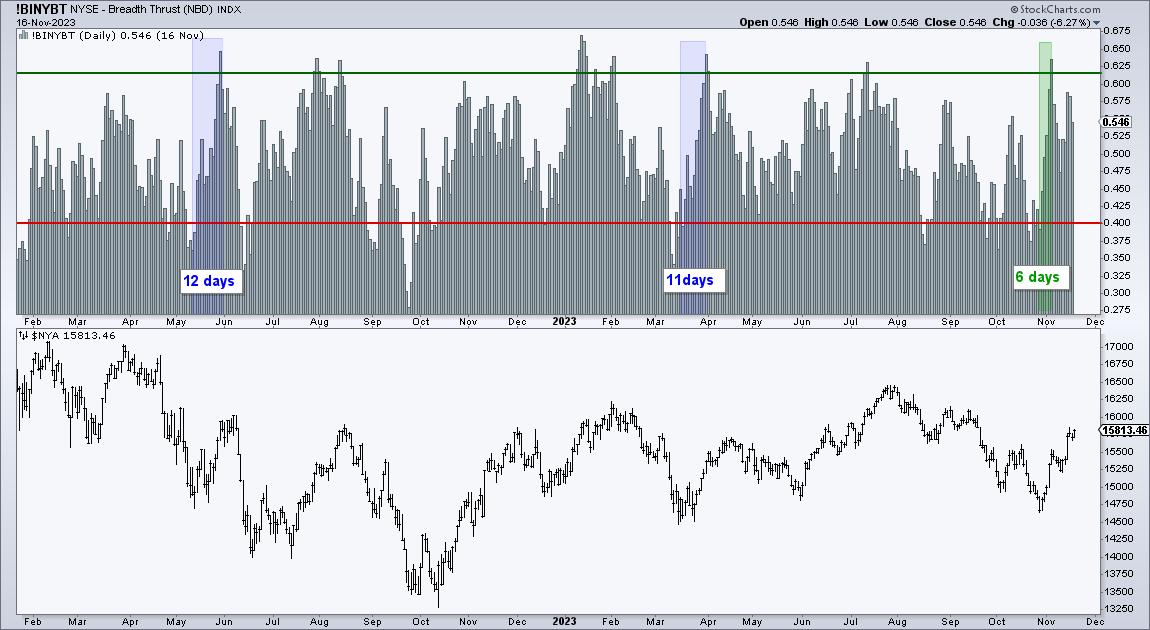
Art's ChartsNovember 11, 2023 at 08:22 AM

Today's report features the Zweig Breadth Thrust, which was developed by the late, and great, Marty Zweig. Zweig appeared regularly on Wall Street Week, contributed to Barrons, published The Zweig Forecast and wrote Winning on Wall Street in 1986...Read More
Art's ChartsNovember 04, 2023 at 11:55 AM

The S&P 500 is battling the 200-day SMA with four crosses over the last eleven days. We are also seeing a rise in volatility as this market benchmark plunged 5.86% in nine days (18-27 October) and then surged 5.85% the last five days...Read More
Art's ChartsOctober 26, 2023 at 10:53 AM
Correlations rise during bear markets. This means more stocks participate in broad market declines than broad market advances. In other words, the odds are stacked against us when picking stocks in bear markets...Read More