
Art's ChartsSeptember 14, 2023 at 09:41 AM
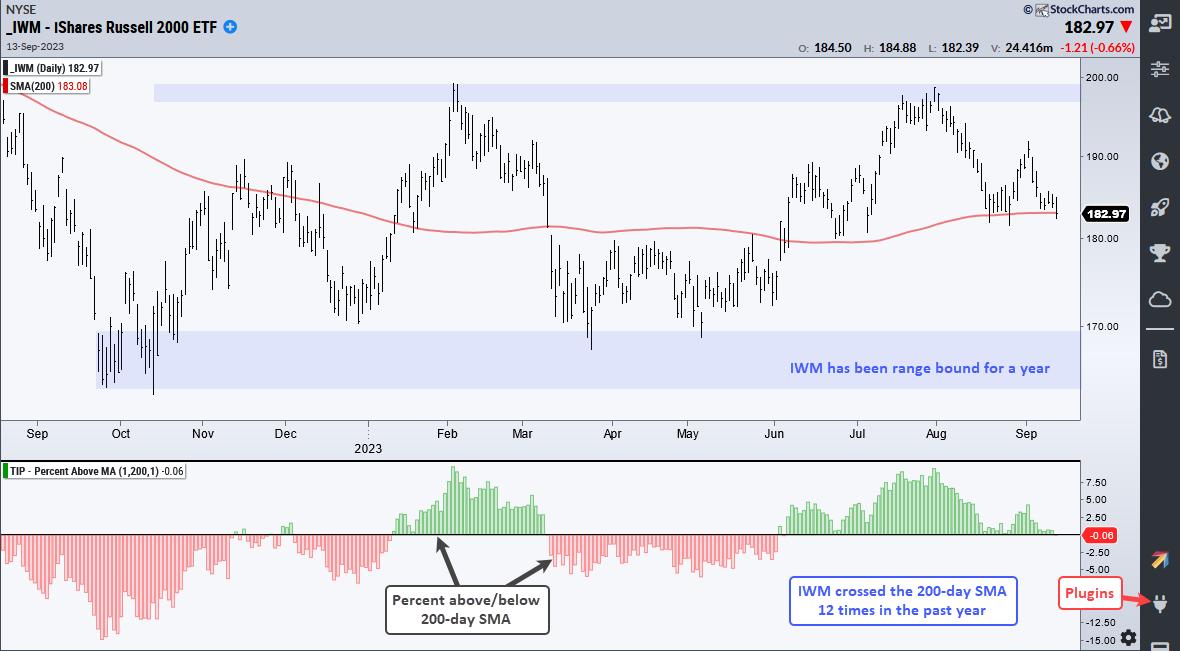
The Russell 2000 ETF (IWM) closed below the 200-day SMA for the first time since, well, June 1st. The last cross was not that long ago and recent crosses simply resulted in whipsaws. Truth be told, 200-day SMA crosses are not that relevant for IWM...Read More
Art's ChartsSeptember 12, 2023 at 11:15 AM
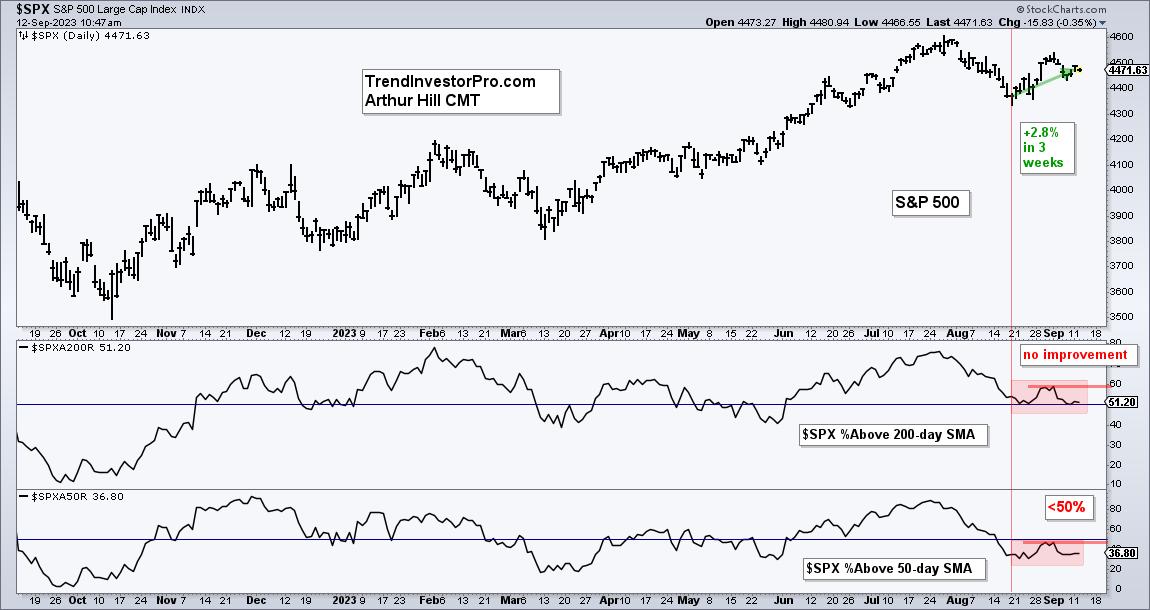
The S&P 500 SPDR bounced the last three weeks, but we did not see an improvement in breadth. Weak breadth is also reflected in performance for mid-caps and small-caps, which are lagging. Even so, SPY and QQQ are in short-term uptrends and I am watching the tech sector for clues...Read More
Art's ChartsSeptember 06, 2023 at 08:39 AM
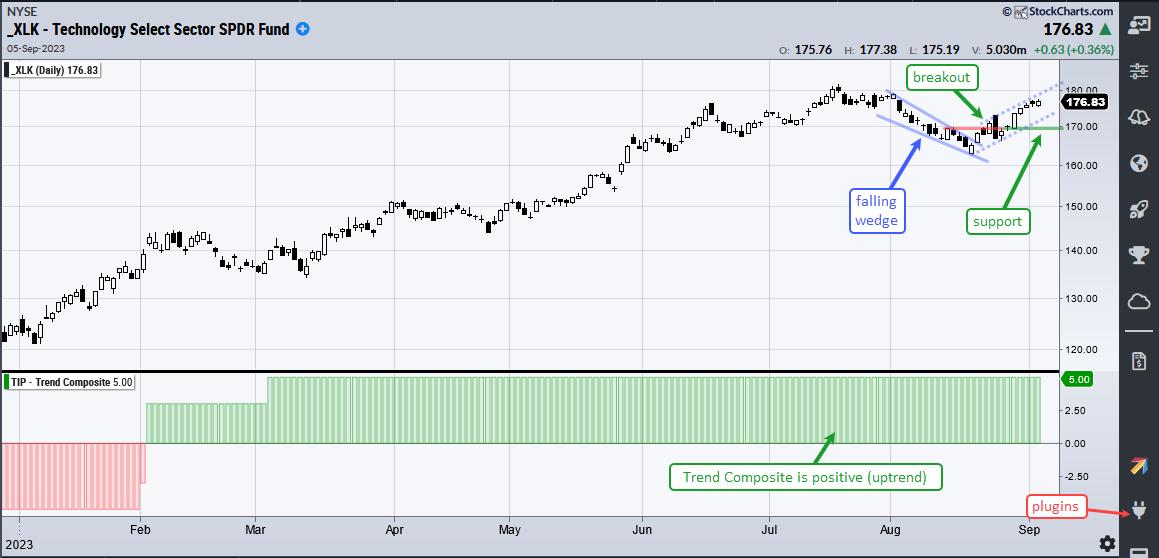
Stocks surged in the second half of August with several ETFs breaking out of corrective patterns, such as falling flags or falling wedges. Even though September is a seasonally weak month, these breakouts are bullish until proven otherwise...Read More
Art's ChartsSeptember 02, 2023 at 09:40 AM
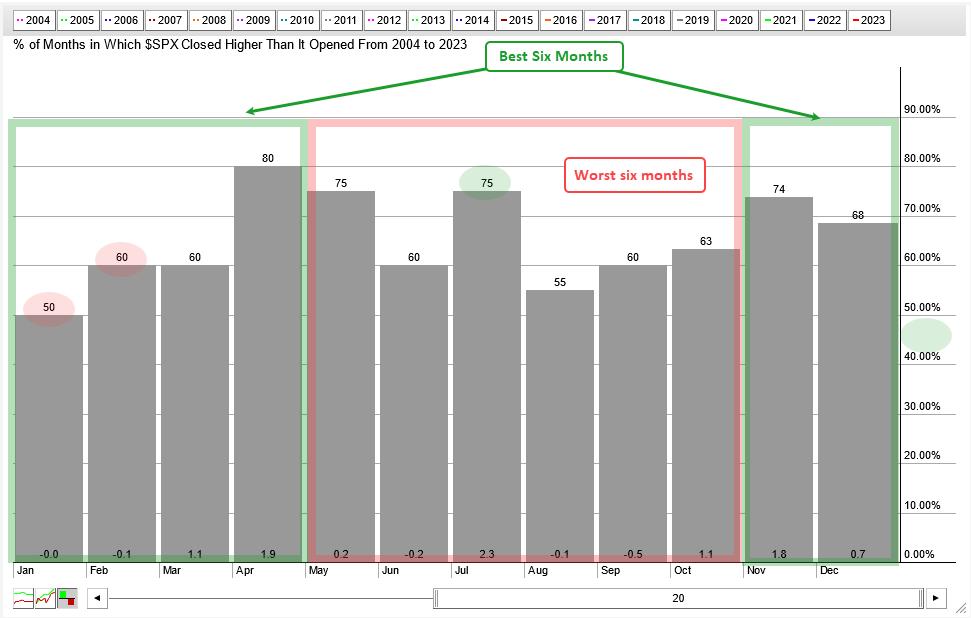
There is some validity to the best six months strategy, but investors would probably be better off with a simple timing tool. According to the Stock Trader's Almanac, the best six-month period runs from November to April. The worst six-month period runs from May to October...Read More
Art's ChartsAugust 19, 2023 at 08:46 AM
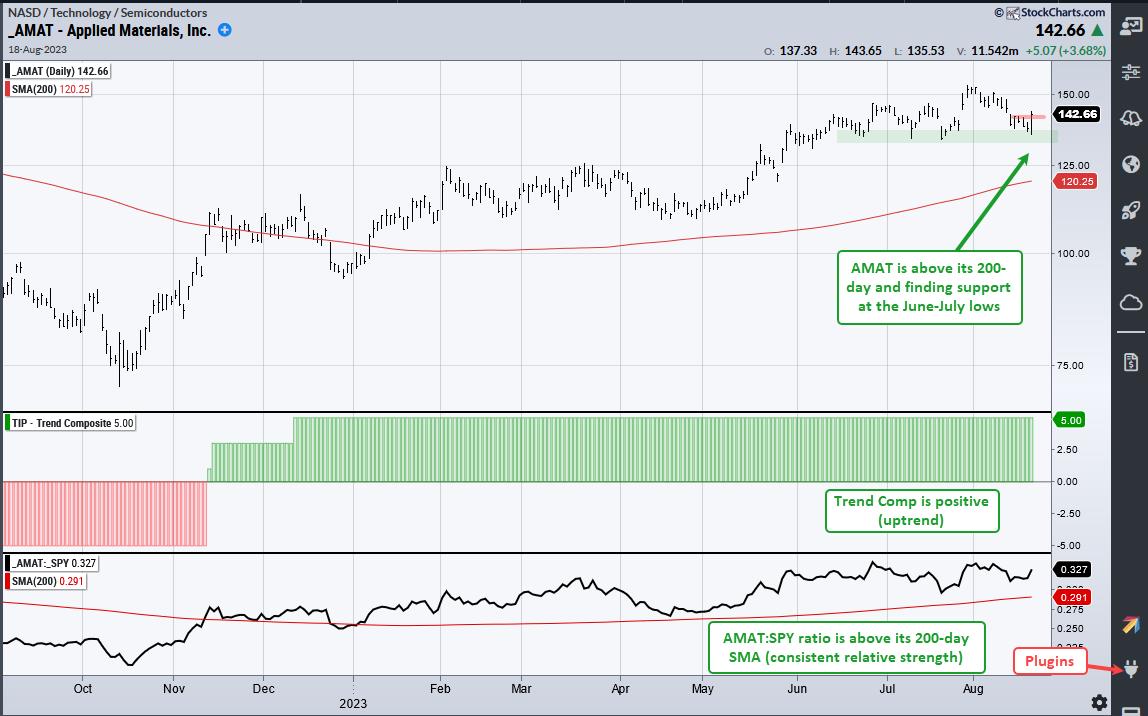
Stocks were hit hard in August with QQQ leading the way lower and breaking its July low. Stocks that did not break their July lows are holding up better and showing relative strength. These are the stocks I want on my WatchList for tradable pullbacks and short-term breakouts...Read More
Art's ChartsAugust 01, 2023 at 12:53 PM
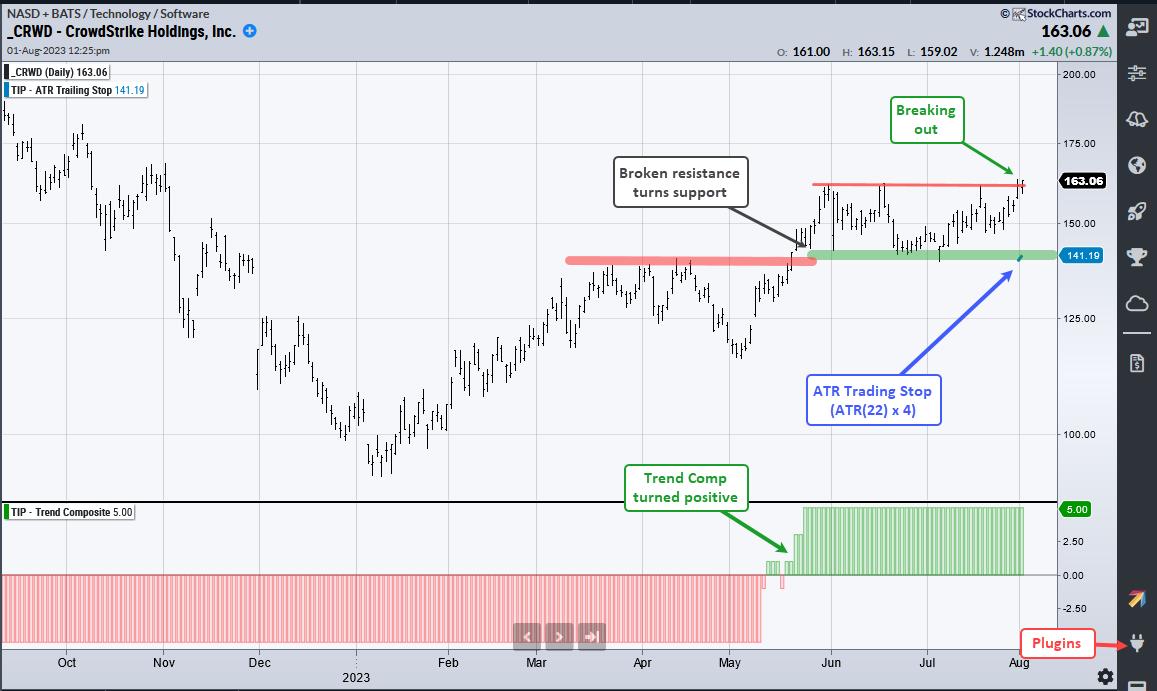
CrowdStrike (CRWD) is separating itself from the rest of the pack with a breakout and nine month high. The chart below shows CRWD with an uptrend working throughout 2023...Read More
Art's ChartsJuly 24, 2023 at 11:27 AM

Cisco (CSCO) is showing leadership qualities again as it breaks out of a classic bullish continuation pattern and hits a new high. The chart below shows CSCO forming a cup-with-handle pattern, which was popularized by William O'Neil of IBD...Read More
Art's ChartsJune 23, 2023 at 08:00 AM
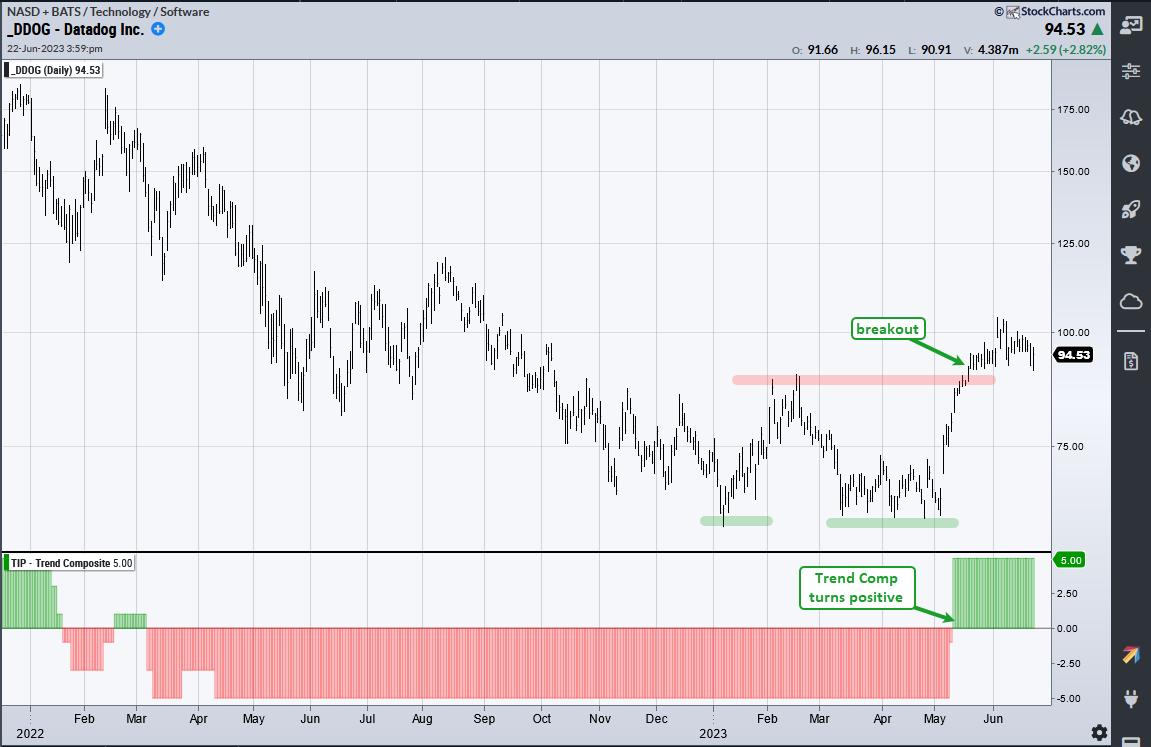
It does not always happen, but sometimes the indicator and chart signals align to send a powerful message. Datadog (DDOG) sports a confirmed bullish reversal on the price chart and a trend signal from the Trend Composite...Read More
Art's ChartsJune 17, 2023 at 04:36 AM
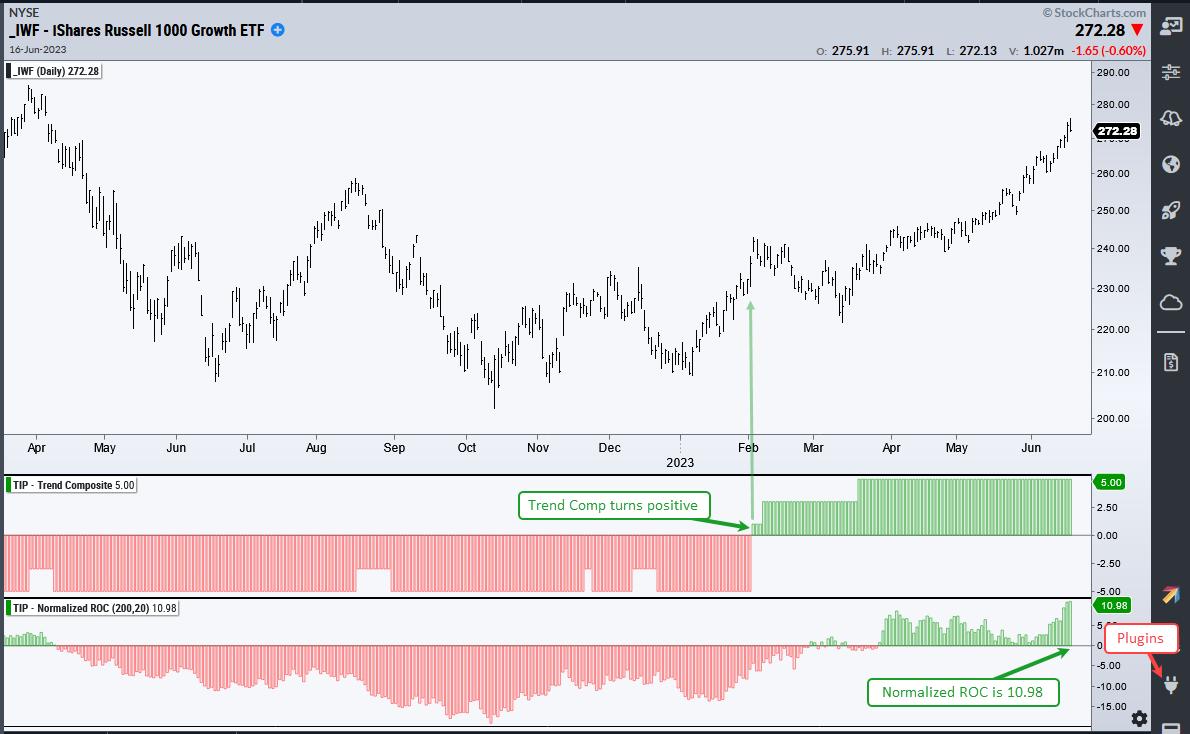
The weight of the evidence remains bullish for stocks, but this is not a bull market that lifts all boats. It is a relatively selective bull market led by technology, housing and a few other groups. This is not necessarily bad...Read More
Art's ChartsJune 11, 2023 at 03:38 AM
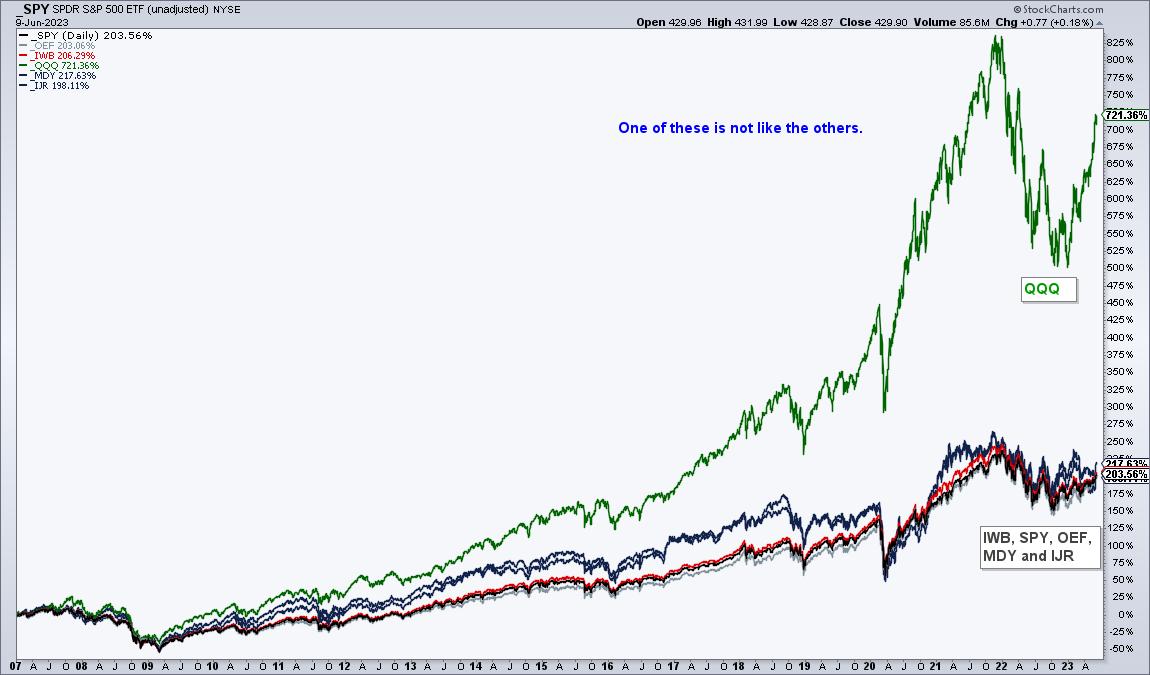
A long-term chart shows why the Nasdaq 100 is the place to be, or at least, "was" the place to be. Past performance does not guarantee future performance. The performance chart below shows the 16+ year percentage gain for QQQ and five other ETFs...Read More