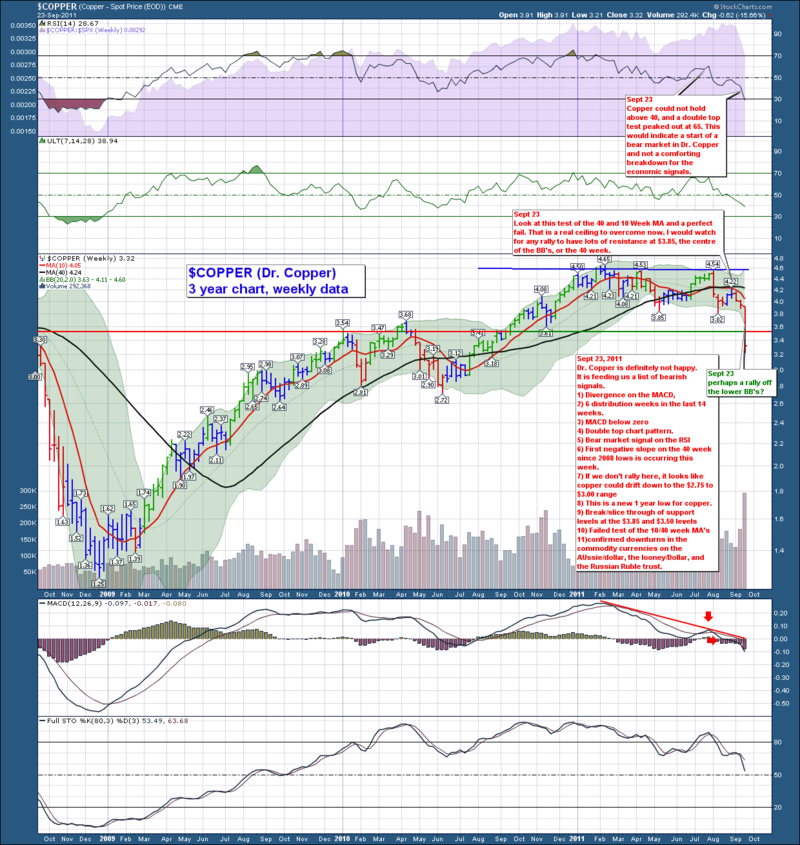
Copper is called Dr. Copper because it is the most sensitive to the overall economic conditions.
Copper has flashed a mess of signals this week. One week doesn't make a trend, and things always look bad on a big down week. However, this chart is building some classic signals that mean we have to watch it regularly. Within the chart I have labelled the list of bearish indicators for the Copper market health.
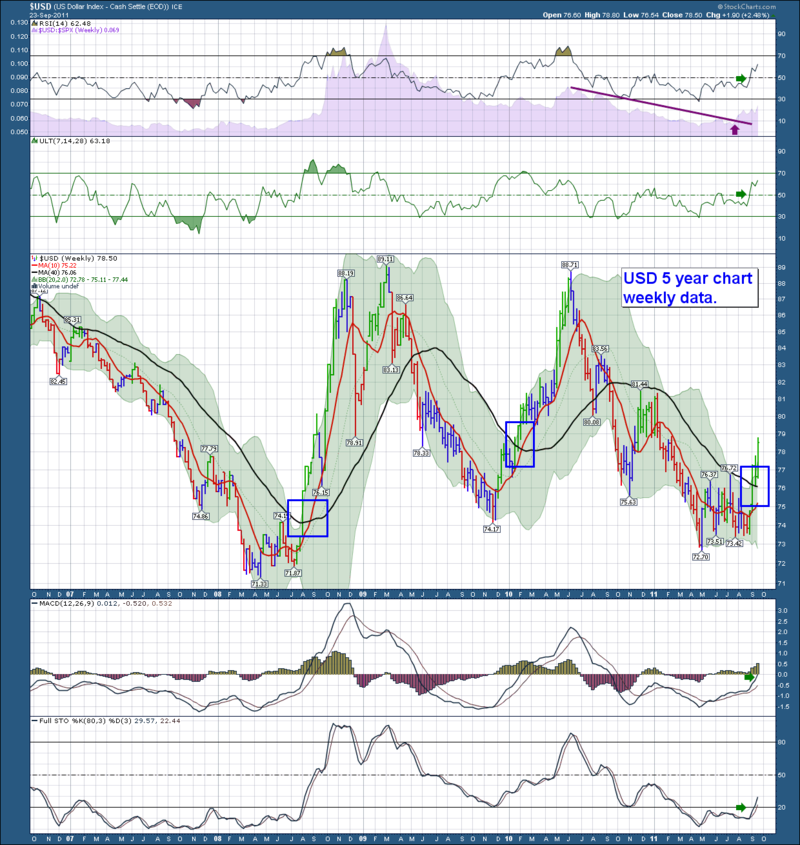
It is difficult for the commmodities to Rally when the $USD is rising. Check out the $USD Chart. Notice the $USD is above it's 200 DMA (40 WEEK MA in Black).
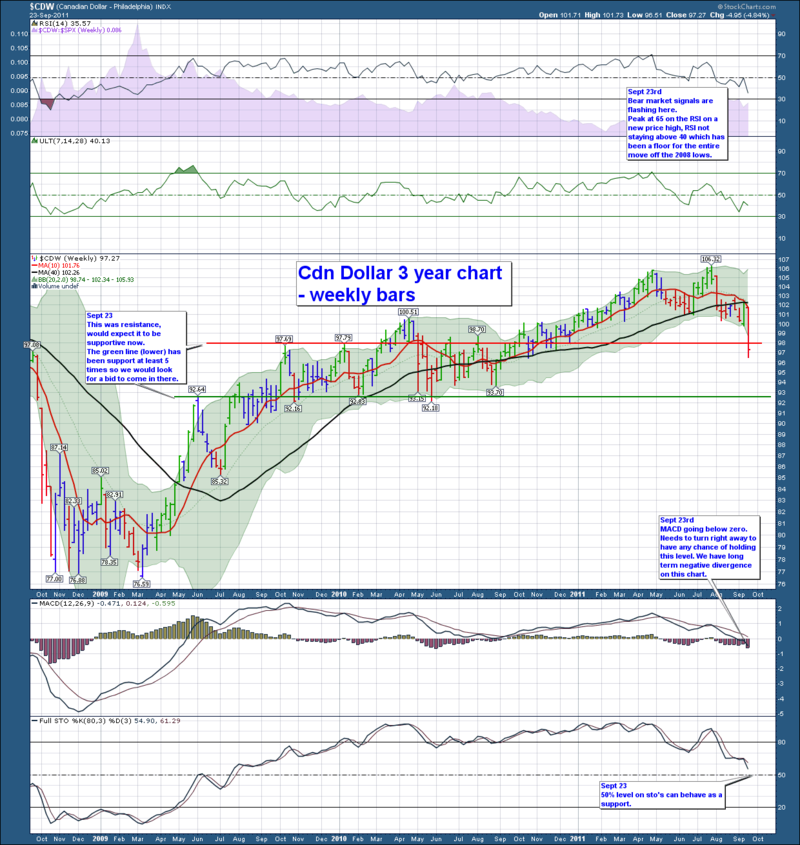
Now check out the Canadian Loonie.
Let's look for more confirming information.
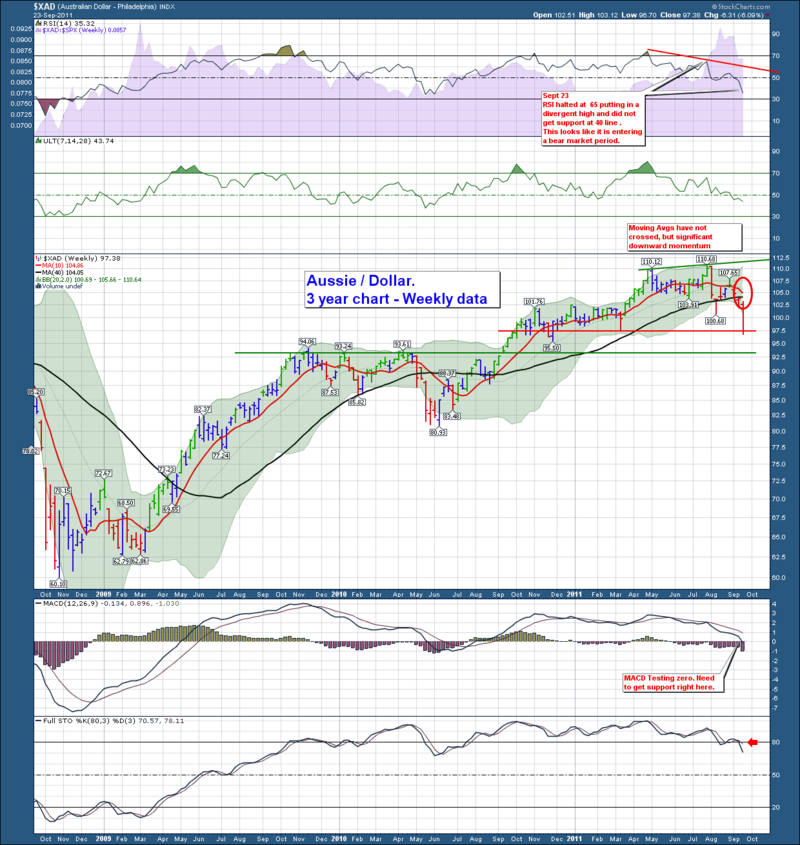
How about the Aussie Dollar. This chart is stronger than the others, but it still breaking down.
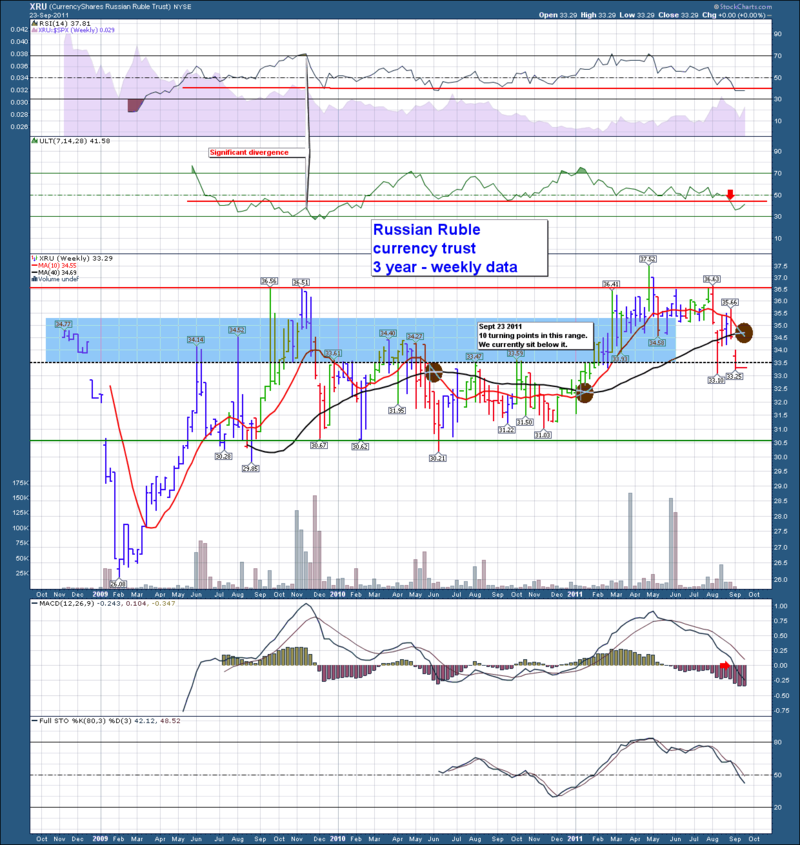
Let' check out the Russian Ruble. It is a currency that is Commodities driven.
I don't have a currency chart for the Brazilian Real, But it was beaten up this week as well.
The bottom line. Copper is telling us the industrial metals are currently breaking down. The commodity based currencies are breaking as well. However bear market rallies are aggressive. I would expect the centre of the Bollinger Bands ( The 20 week MA) to provide resistance on any rally.
The beauty of technical analysis is we can see where we should change our decision. Currently, all trends are bearish. But interim rallies are aggressive as the shorts get squeezed.
Greg Schnell, CMT

