OK, Where is oil going?
Who knows, but what should we watch for?
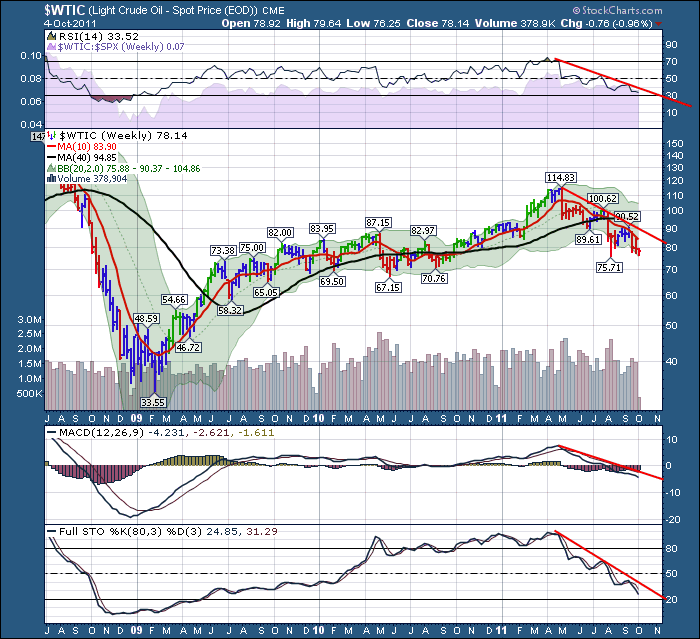
1) Let's check the trend.
Hey, that is not an uptrend. OK, so Oil is going lower. Well, where will it stop or at least find some support? If it does rally, how do we know when it is changing direction?
Well let's figure out where to look for stops. Long term stops would probably locate below the $70.00 level, and really long term stops would be below $67.
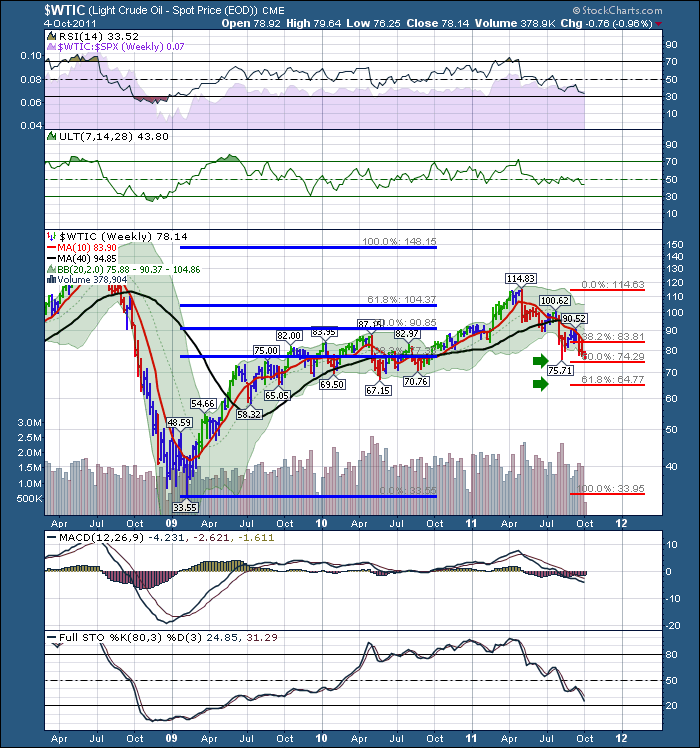
Let's figure out where the Bollinger bands are, Let's figure out how to use the MA's. Hey we could use Fibonacci! Lets plot them.
Well, When we bounced off the 2009 lows, we rebounded to 38%, then about 50% and held there for almost a year.
So far, we have retraced 50% of the rise from the 2011 highs. Will, that be it? Great Question, but the low RSI reading (Well under 40) usually indicates the start of a bear market. So I would expect any rally, to stop below an RSI of 65. SO a downside target if $74 does not hold would be $64 based on Fibonacci. Ok, That's one upside target (RSI) and some strong places to look for support. The 50% retracement, and the 61.8% retracement are logical places for the market to rally from. A rally may not be a new bull market.
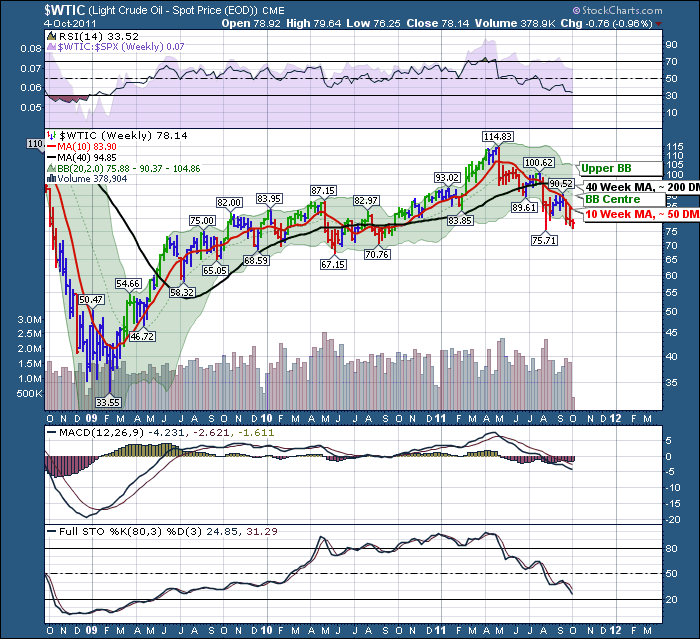
Now let's check the BB's (Bollinger Bands) and the MA's (Moving Averages).
The Moving averages tend to be levels you can expect support on an uptrend, or resistance on the way down.
The centre of the BB is very important. It is almost a mood line. When below, it's hard to get happy. This line tends to be resistance and it keeps knocking the price down. Conversely, when it gets on top, it has the opportunity to run higher for a while.
I would expect the 50 MA, to be difficult. I would expect the Bollinger band centre to be very difficult. I would expect we can't get above the 200 DMA (40 week) without some positive divergence on the MACD.
So my current bias is with the trend. Down. But rallies up to the 50 MA and the BB Centre would be normal.
Click on the charts for a larger version. Click on the RSS feed , or on the subscribe for your email basket to get The Canadian Technician regularly.
Good trading,
Greg Schnell, CMT


