As Technicians, we have the privilege of comparing different stocks, commodities, currencies all on the same chart. Too cool.
John Murphy (The Blog Writer at Stockcharts) wrote a book called Intermarket Analysis that really had technicians in disagreement for a while as he stepped out from previously understood conventions. Today, this book is a required reading for the CMT designation. Upon finishing the book, you are compelled to try to utilize the body of knowledge he was departing by producing endless charts of comparisons.
Some of my favorite charts are derived from Intermarket Analysis. In speaking with a long time technician the other day, he stated that the fastest sensors to change are in Forex, then Bonds, then stocks. Maybe we should look there for a clue.
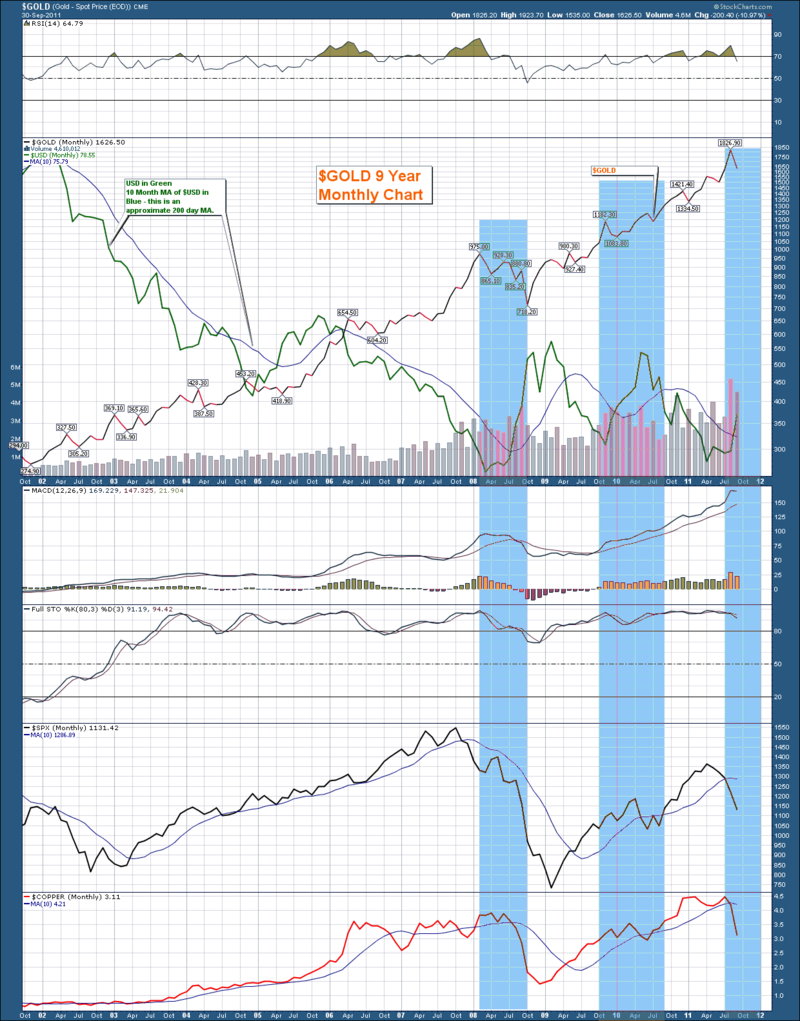
We are all wondering if Gold is in an intermediate stage bounce, or actually impaired long term. So I tried to chart it with a few intermarket ideas.
If we examine this chart in order of the boxes, we can find some interesting clues.
The main Price box features $GOLD and the $USD. In general, commodities usually fall when the $USD goes up. A commodity price is affected by currency movements but also has global pressures that change it's value, like growing economic countries increasing demand, recessions, inventories, supply, weather, etc. But if you isolate all other factors, examining a change in the $USD would be helpful towards understanding how the change in the $USD affects the price of $GOLD.
If you are really new to the markets, let's pause to explain this otherwise Intermarket won't matter! I'll use oil so it doesn't confuse our discussion.
Sitting in Canada, Oil has a world price calculated in $USD. Lets say $100 for 1 barrel for easy math. If the $USD goes down to 0.99 Cents (down 1%), the price of oil in the rest of the world retains it's same value for 1 barrel of oil from yesterday by raising the price of Oil to $101 $USD ( up 1%) as an example. So it costs the same in world value if all other things remain stable. Conversely, if the $USD rises, Then the price of oil falls to $99 $USD to maintain the world price of the commodity compared to yesterday.
That is a very simplified example of how currency (especially the $USD) affects the price of a commodity for Canadians. IF you can take the Coles notes, Commodity prices in $USD move in opposite directions compared to the $USD.
Back to the charts.
Notice on the last three peaks in Gold where it broke down more than 10%, the $USD was exhibiting an upside breakout as well. Not all price moves in a commodity are currency related but currency is a big one.
Well,
In all three blue shaded areas, the $USD went on a tear. In the middle one, the only issue on gold was it broke down hard then strongly rebounded during the period the $USD gained. Interestingly, the $SPX rallied in there and then fell back to be flat over the period. Lastly, Copper in Red at the bottom, did the same. Maybe we should check our other intermarkets, like bonds...and so it goes!
You can be long commodities when the $USD is falling, but you may need protection when it's rising.
Currencies are one factor. All the other attributes of the commodity are another.
Having trouble reading my chart? Click on the chart to be linked to a larger realtime version. Subscribe through email or RSS feed on the top right of this page.
Good Trading,
Greg Schnell, CMT


