Normally, I focus on the Canadian market, but today we need to explain what the dynamic currently in play is on the $SPX.
Recently, my blog of November 1st tried to explain bull and bear market cycles using the RSI.
1)In the article I explained how the market oscillates between intermediate term bull and bear markets. The RSI helps us spot those and stay in the trade.
However, one of the most important market signals for managing your investing style is the slope of the 200 DMA.
We need to understand how critical the market signals are once the 200 DMA starts to have a downward trajectory. This line gives you one significant clue that you can use with the intermediate RSI analysis. At the end we will summarize the four stages. Just how rare is this? Over the last 22 years, this is only the 5th time the slope has been negative for multiple months. We'll examine each of these conditions below.
Why is it important?
1) Conservative Mutual funds try to stay in growth sectors (Technology, Energy, Consumer Discretionary, Financials) when the $SPX price is above the 200 day moving average (DMA). As long as the 200 DMA has an upslope, the market has a positive trend. When the 200 DMA reverses to a downtrend, Conservative money managers try to protect capital by staying in slower growth , dividend paying defensive sectors like health care, consumer staples (toothbrushes, groceries) and Utilities. If the market can move above the 200 DMA, they start allocating money to more aggressive sectors.
2) So we are at the line in the sand for the second time in 7 days. Trying to get above the 200 DMA to make this market go positive.
3) We have the same issue on many charts where price action is hovering or testing the 200 DMA. Other example charts are the $USD, $WTIC etc.
First lets cover off the shape and trajectory of 200 DMA on the 2011 $SPX chart. 200 days trading is slightly less than 10 months. Lets look at where the line is currently, the slope of the line and compare to the previous years to see how it acted at that line when it had a similar profile.
I put the current chart at the top so we could quickly refer to it.From here let's investigate 22 years of data in a few minutes!
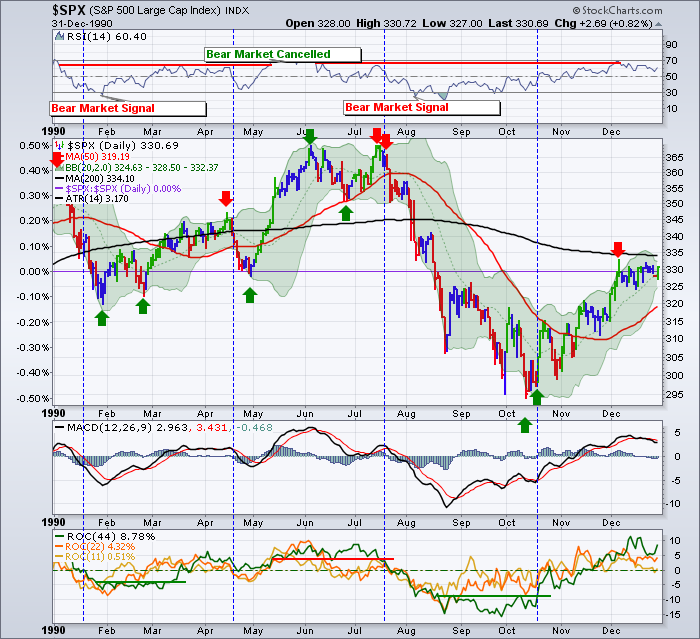
Here is the 1990 Market with the start of a downsloping 200 DMA. Notice around December 1st, it failed at the downsloping 200 DMA. Let's see how it responds from here.
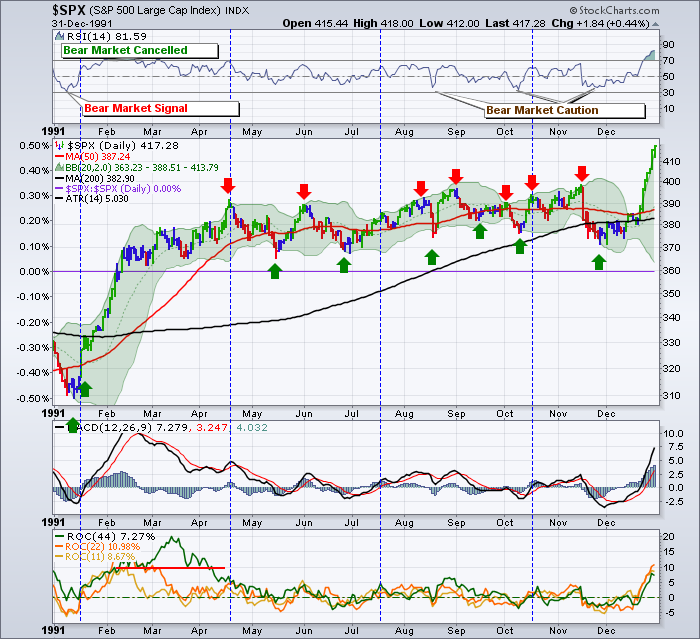
Here is 1991. Shortly after the failed 200 DMA test in 1990, the market fell down 10% but did not make new lows. The RSI at 30, was a pretty good place to buy the dips for a tradable rally. Well, on the next test of the 200 DMA it broke through. Notice how it paused there (Patch of green oscillations) at the 200 DMA. When it broke through it was a nice big move!
This rally lasted all of 1991, 1992, 1993 and into 1994!
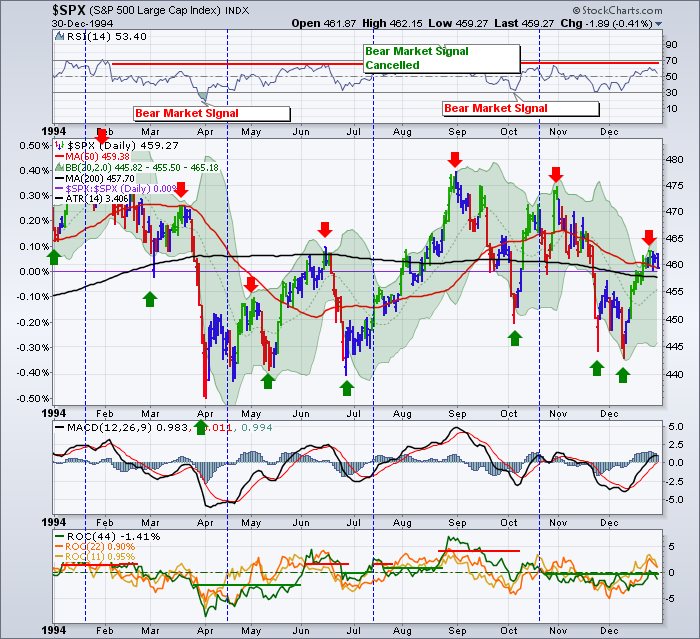
Here is the 1994 chart. Look at the trips across the upsloping 200 DMA and notice how it starts to flatten out and roll over with a gentle down slope.
Price was resisted at the first and second test of the flat or sideways 200 DMA from the bottom in June.
Then, the 200 started sloping down. The price action oscillated above and below that line all year. For the last few months, the 50 DMA was above the 200 DMA. This was an incredibly hard market.
Price was supported in September and October at the 200 DMA, but it also broke below twice. TOUGH market.
There was one bull market signal on the RSI in 1994, and it was cancelled soon after with a bear market signal of a low 30's RSI in October.
Is the rally in June more like our current rally or look at that beautiful December rally..what would it lead to? One tested and stopped at the 200 DMA twice and one made it through for two weeks.
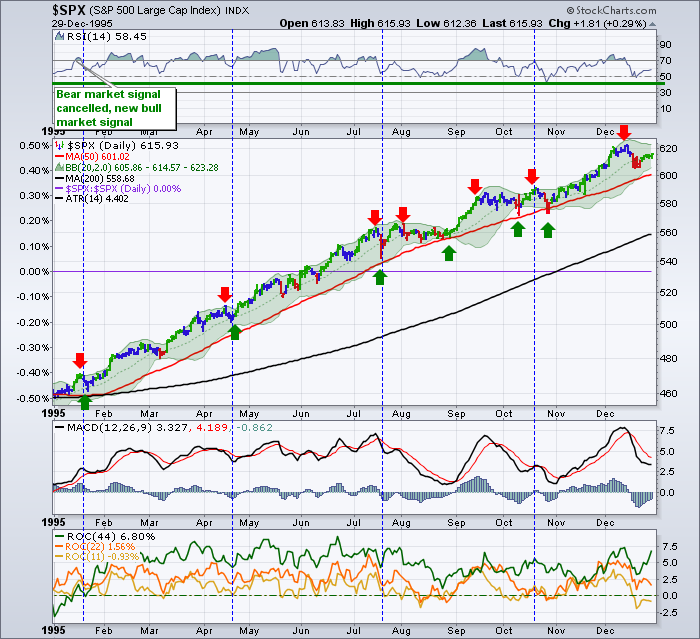
What would 1995 Bring? An unbelievable Rally. But look what line demarcates the start. A break above the 200 DMA. A bull market signal on the RSI to kick off the year literally. January 1995, the price was able to get above the 200 DMA and stay there. The clue this was for real? A bull market signal on the RSI.
So how long will the rally last. At least until the 200 DMA slope starts to roll over. The slope was uphill for all of 1995,1996,1997,1998,1999, and it started to roll over in 2000. Wouldn't you like to be getting long the market as it starts that run?
So the run continued with an upsloping 200 DMA till 2000! Nice clue to stay long the market!
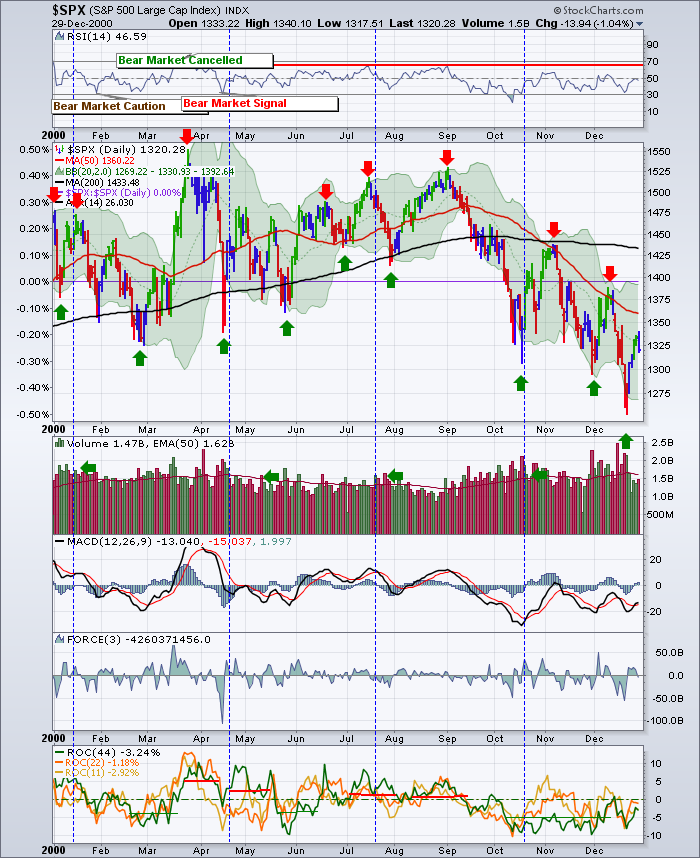
Here is 2000. Notice the first test of 200 DMA from the bottom was rejected.
This test and fail would mark the start of a three year bear market.
The 200 DMA was in a downtrend the whole time. Were there great tradable rallies? Absolutely. You just needed to know that you had to take profits early and often, rather than buy and hold. But the confirming start of this bear market was:
1) A bear market signal on the RSI.
2) A failed test trying to get back through the 200 DMA.
When it couldn't do that, you had to stay defensive. The market only rallied above the 200 DMA once in this 3 year period. It was in 2002. Yeah, the second test of the 200 DMA took almost 18 months to occur.
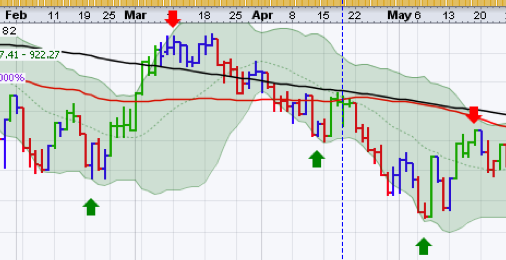
Here is a snippet from the chart.
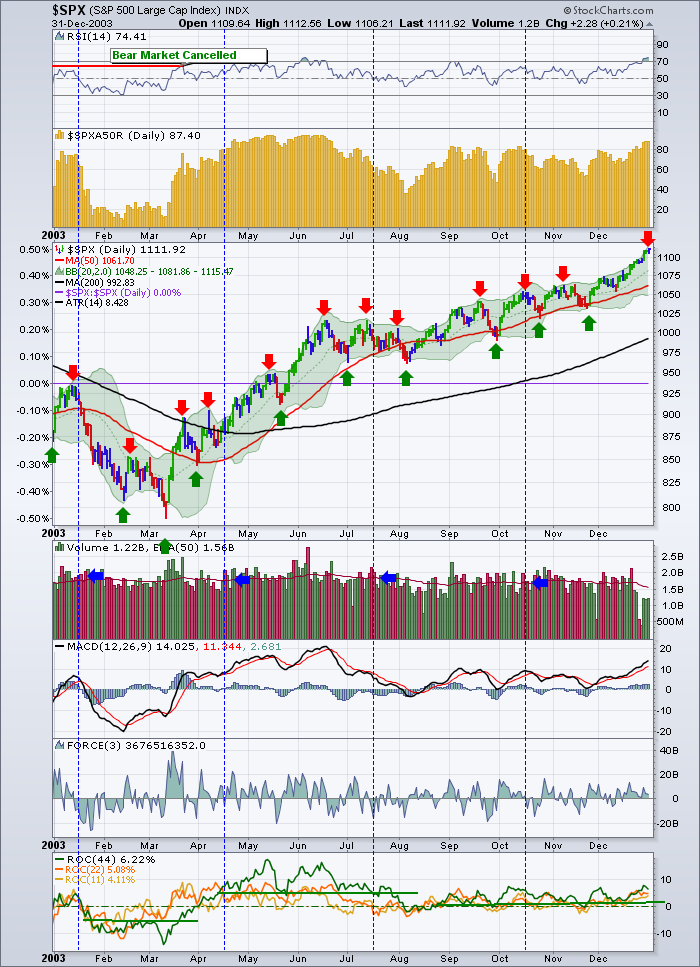
Well. The market went on to lower lows for another YEAR! It finally tested the resistance of the 200 DMA again the following year. It tested it in January and failed, then it tried twice in March/April where it finally pushed through. Here is that 2003 SPX chart where it pushes above the 200 DMA.
You may remember the 2003 bull market started a 5 year run. 2003, 2004, 2005, 2006, 2007 all had upsloping 200 DMA chart action!
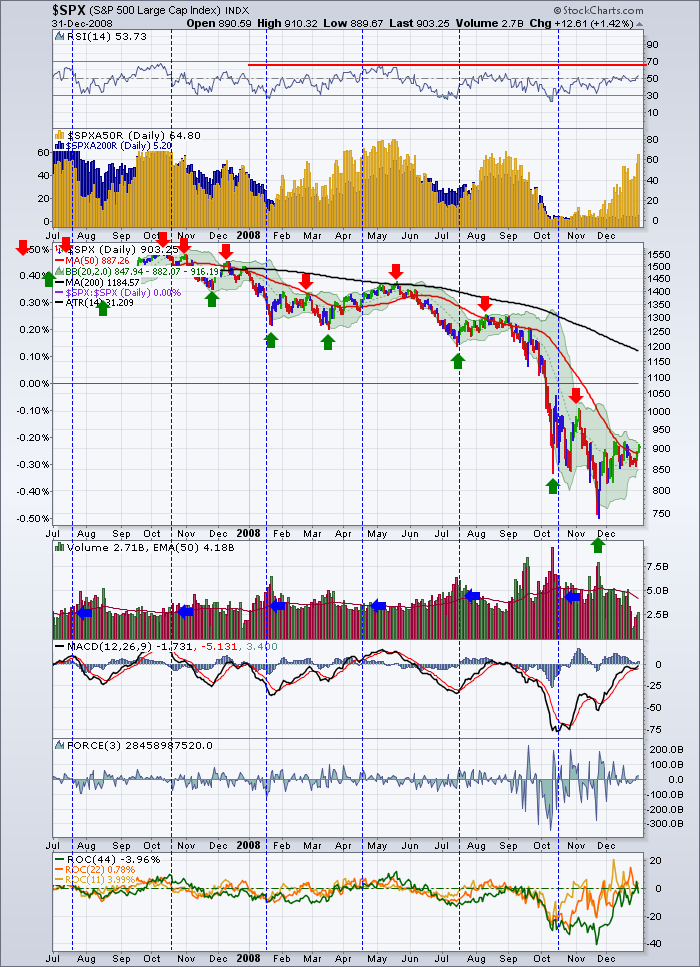
Let's fast forward to 2008. Here is the 200 DMA rolling over. Remember the top of the market was in back in October 9 2007. We know this in hindsight, but we didn't know it then. I have extended this chart with some of 2007 so you can see the market top in October 2007. The market moved below the 200 DMA in November, tried and failed twice to get back above it in December and then failed in May once again.
Well, that makes a rollover 200 DMA in 1990, 1994, 2000, 2008, 2011. It's funny how we think of the 200 DMA as a Moving average to be relevant. But here we sit testing one of the best indicators in the market today. Obviously a pullback from the 200 DMA again this morning, but its never over!
Once the RSI has given a bear market signal we have to watch the price action.
Here are some trading scenarios I have written down to help eliminate the noise.
1) Usually a safe buy point is signalled by dips in the low thirties on the RSI.
2)A trader does not have to trade in and out of each pullback when the 200 DMA is sloping up. A trader can also add when the market pulls back and will most likely have another exit higher up than the buy point.
3) When the 200 DMA is sloping down a trader should set targets and prepare to sell when the RSI is between 50 and 60. However it can stretch all the way to 68. That is a lot of profit between 50 and 68.
4) Should the market climb convincingly above a down sloping 200 DMA, a trader wants to be on this train.
The whipsaws in 1994 were difficult. We could easily experience them again. But 3 whipsaws finished only to give you a 5 year run!
To subscribe to the blog by RSS feed, Twitter or email, follow the link and click top right.
Thanks to all of you who have taken the time to send feedback! Its greatly appreciated.
Good Trading,
Greg Schnell, CMT


