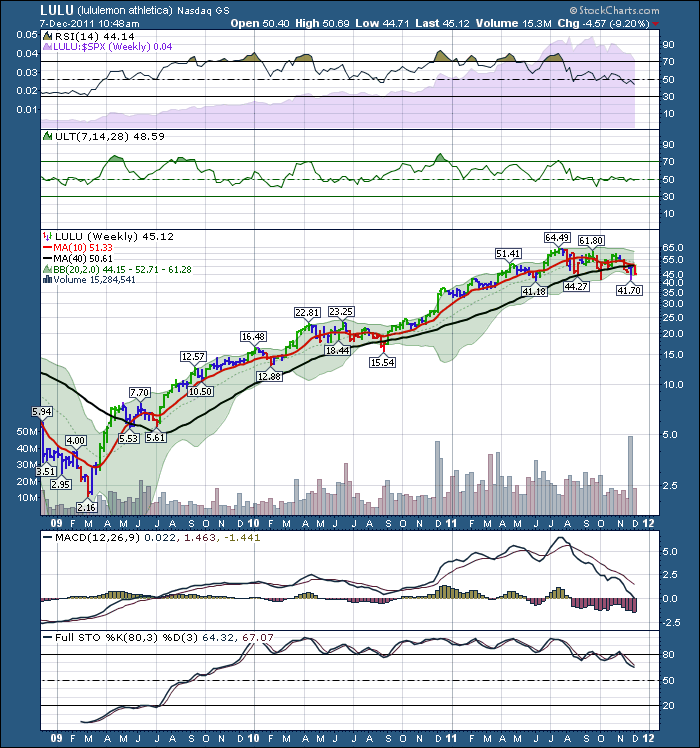
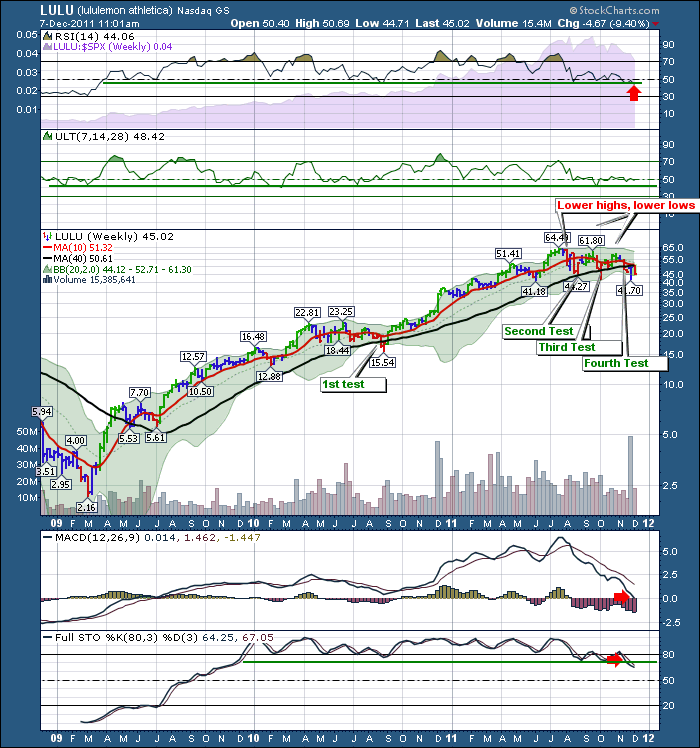
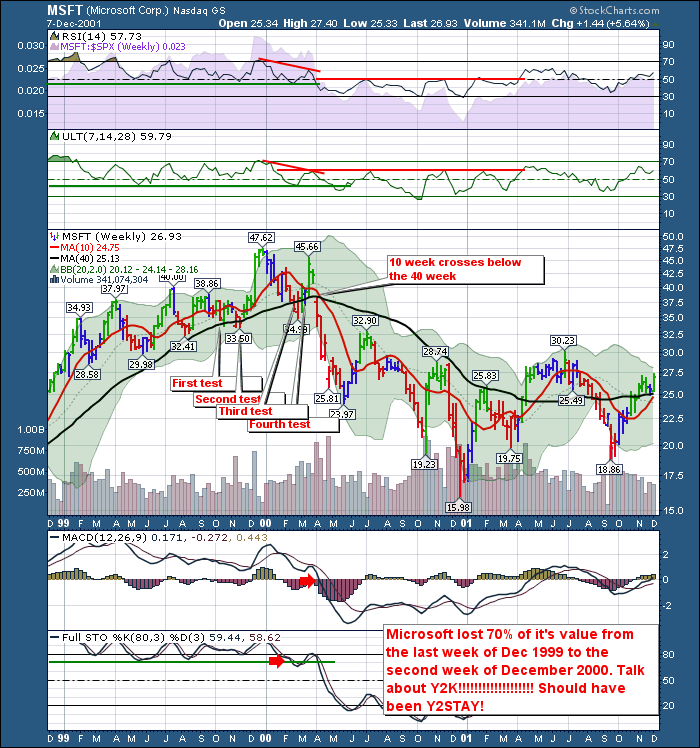
Hummm, this chart needs a little annotation.
We need a little background information. How do great stocks signal their final top? Lets take some random examples. I want to take one of the greatest growth stocks of all time, not just a retail stock.
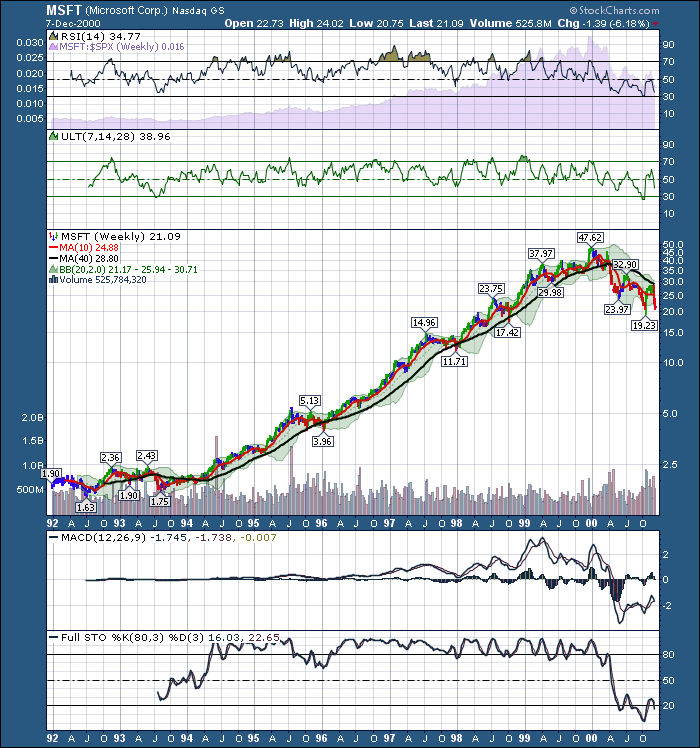
Here is Microsoft. 10 years of weekly data through the 1990's. Obviously the stock split so many times so the prices look pretty darn cheap!
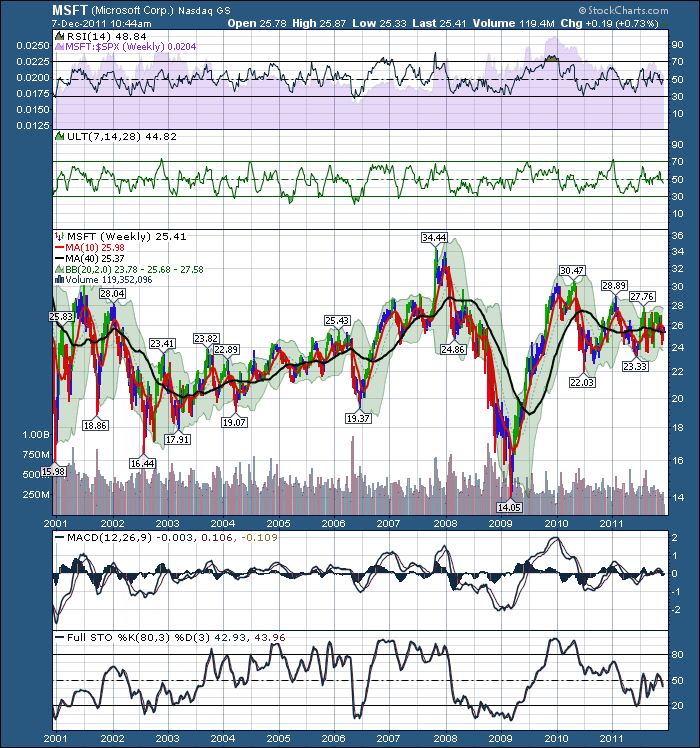
Now, here is MSFT for the 2000's.
So let's briefly analyze this pair of charts. Look at the final days of Microsofts great run in the first chart. Notice how the stock gets supported at the 40 week MA and the 10 week doesn't cross below the 40 week in 10 years. Woo hoo! Nice run! Notice the transition to the second chart.
Look what happens at the top. It tests the 40 week and gets support 3 or 4 times. The institutions step in to support the stock, and buy more as it pulls back. What really starts to happen, is it continues to test the support of the big institutions. It tested it twice in 1999 while the BULL market was RAGING!
Lets zoom in on the final year of the run. The subsequent follow through.
OK so if the greatest tech stock of all time, broke down before the results of all the Y2K spending had fully been announced on its balance sheet, why would LLL.TO be able to hold up any better?
The fact that it is breaking down before Christmas, not like in July of 2010 is important. This is Bull time for strong retailers. If the stock isn't strong now, it will be remarkable to still be strong in April.
Let's start on tthe RSI. We are right at the RSI 50 line. The strongest retail stocks are not sitting on the RSI 50 right now...! Go see Macy's as an example.Look at how bulllish the RSI was in December of 2009, 2010. Compared to 2011, we should be asking the bartender for another shot of rum primed Eggnog.
Let's check the Ultimate Oscillator, which combines 3 cycles. No pressure to move higher in the prime season.
The price chart shows 4 tests of the 40 Week this year. The real statement is the time of year that we are testing all of these levels. At Christmas, we shouldn't test the 40 week on a strong retail stock. The 10 week falling through the 40 week is almost assured if you count back the number of weeks to see what is falling off. The 10 week should not dive below the 40 week ahead of the strongest season in a strong stock.
Check the MACD. They are diving at the zero line.
Check the Stochastics. Lowest level since 2009.
OK full disclosure. I just bought a birthday present for my 16 year old. She asked if she could return it for something else. She still got the something else at LULU but I could see the luster is weakening. At a gathering of 10 teen girls for the same birthday, I asked if LULU was still fashionable. They still think it is. So I am not as bearish as I might be if they answered too expensive as an example. Let me add one final chart analyst dart. Look what we tested and failed on Monday. A retest of the 200 DMA on the daily chart...! Before Christmas!
So this chart scares me. I would suggest the technical probabilities of LULU topping out here is big. Never a guarantee, but pretty strong. I even have a chart list called great historical topping patterns. I can add NFLX and RIMM for 2011.I would be premature putting LULU on the list, but it is on the watchlist.
Homework. Go look at CROX, INTL, CSCO and see if you can find topping patterns. How about POT.TO?
How will you know when it is time to leave TET.TO? It is important to understand how great growth stocks top. The ending are swift and severe. Multiple tests of the 40 week DMA are a gift. NFLX was not as kind. When it tested it, it was over! A single stroke! So, my Christmas gift for this year is to be very aware if one still owns LULU or LLL.TO!
Hey, for all those that have sent comments, thank you. If you like the blog, keep letting me know. If you would like a Canadian stock (Over $5) analyzed, we could try to accomodate that. Or a sector!The hardest part of writing a blog, is to keep it engaging. I would like your help in that!
To subscribe, follow the link below to The Canadian Technician blog and click on subscribe in the top right. You can also like Facebook or Twitter tweets! If you have some European stock friends in the market, let them know about the real time charts available on stockcharts for very low dough!
Good Trading,
Greg Schnell, CMT

