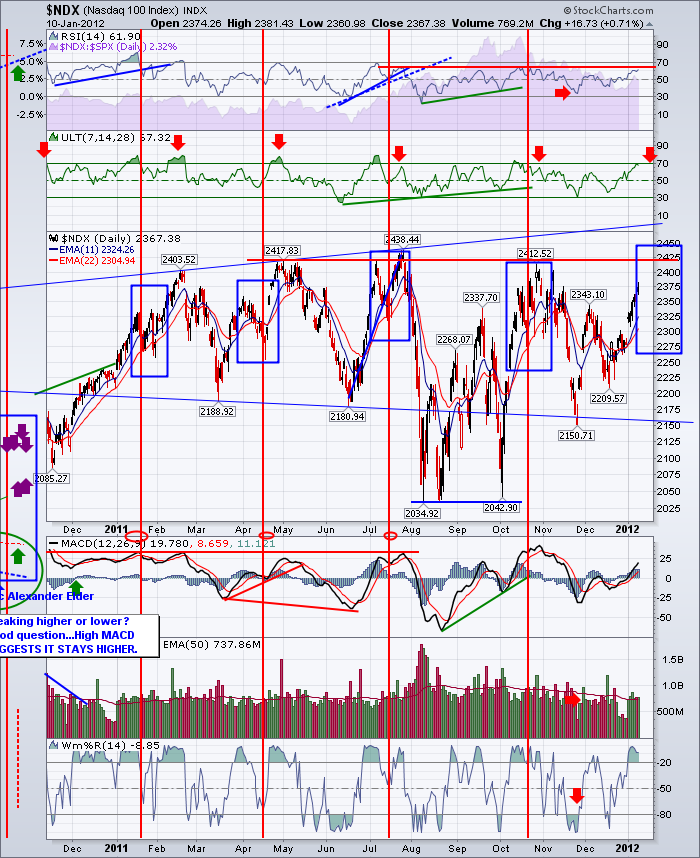
Today I want to present one chart.
This is the index for the top 100 stocks on the Nasdaq. The Ticker is the $NDX. Why does The Canadian Technician bother to plot the Nasdaq 100? Well, it tends to be a composite of some of the exceptional stocks in Technology.
But the second reason is, how clear the pattern of earnings releases shows up on this chart. The boxed area is the pinnacle of the earnings announcements. The red vertical line is the Options Expiration date.
In the last 5 quarters, this market hasn't made any headway. It rallies into the earnings and sells off after the earnings. So when your feeling bullish and the earnings are winding down, do you need a strategy to control the decline of your account? You decide.
Does this current rally look similar to the last 4? Absolutely! Now the question is, will it sell off after?
Let's enjoy the drive through earnings.
What I really did not like today was the action in the big Nasdaq stocks.
GOOG - underperformed the Nasdaq Composite today
AAPL - underperformed the Nasdaq Composite today
AMZN -underperformed the Nasdaq Composite today
MSFT - underperformed the Nasdaq Composite today
ORCL - underperformed the Nasdaq Composite today
CSCO - underperformed the Nasdaq Composite today
EBAY - Outperformed the Nasdaq Composite today
INTL - Outperformed the Nasdaq Composite today
The Disk Drive index looks weak, the Semi conductor index looks better.
If the market starts bidding up the Dow and not so much for the Nasdaq, I'll be looking for the exits.
Good Trading,
Greg Schnell, CMT


