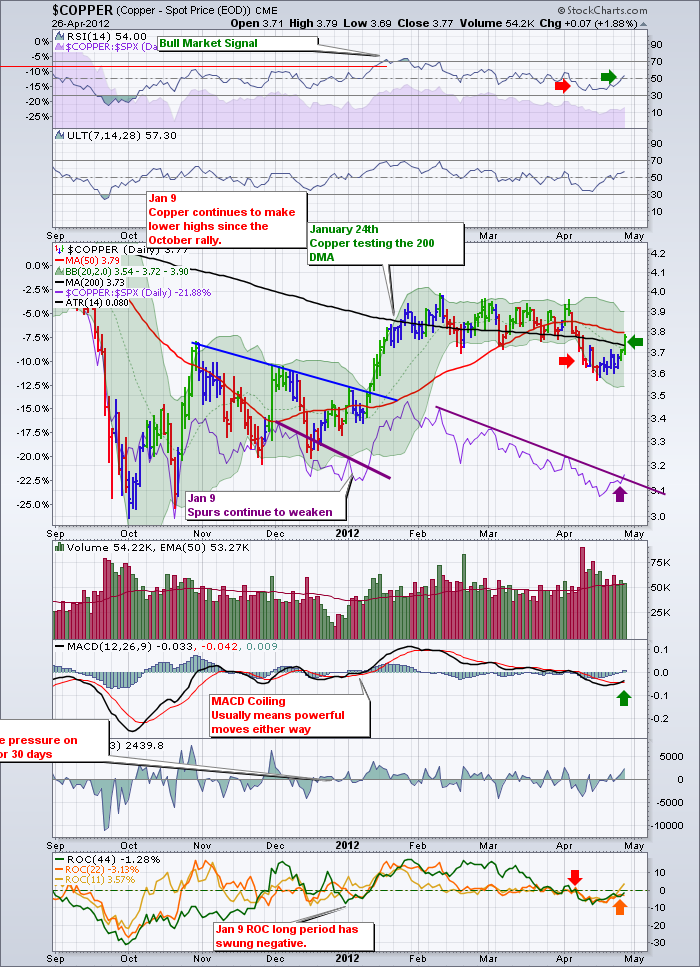
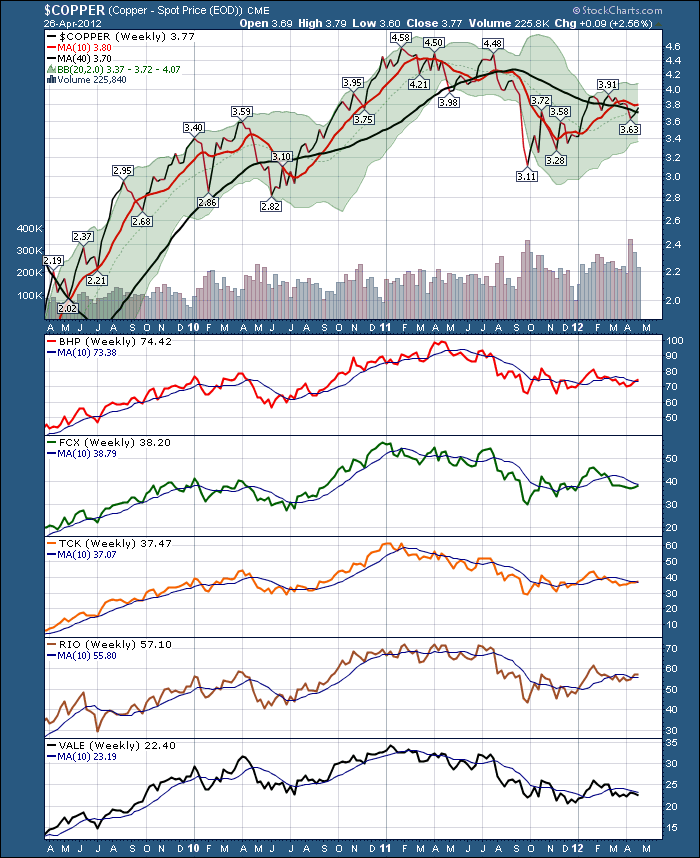
It has been an interesting week for Copper. If finally got some momentum to the upside and had a stellar day on Thursday. Dr. Copper is a strong indicator of economic activity so having it weaken so substantially since Feb 1 is concerning. We need copper to turn bullish. Lets go data mining here.
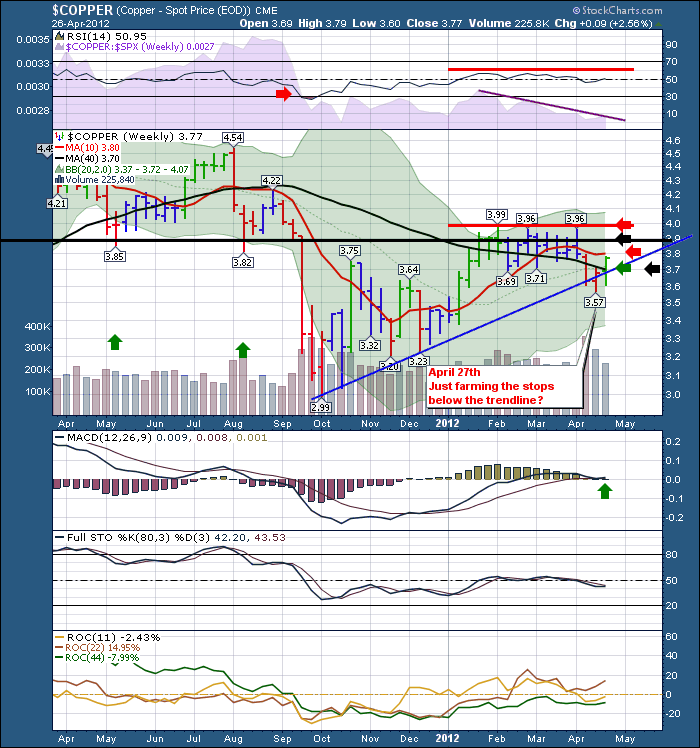
Lets check the weekly. Any hope of some Bullish action there?
First of all, the RSI gave us a bear market signal where the red arrow is. So our major test will be if $COPPER breaks out to the upside and can get bullish on the RSI by reaching overbought and starting a new bull market signal. It needs to get bullish on the daily first, and it has. So we are in a period of wondering if it is a new bull market in copper or just a bear rally as both time frames don't agree. Currently, this would be considered a bear market rally and we would expect the rally to top out below 65. The red line is drawn at 60. It is still a good rally from 30 to 60 but you have to be careful as the weekly RSI is telling you a bear market until it finally reaches 70 and starts living above 50 on the weekly RSI. Lastly on the RSI, you can see it briefly dipped below 50 and came back above. That is bullish. You can see the purple SPURS line in the background has not broken out yet. Is this just a one week push?
On the price chart you can see the alternating black and red areas of resistance. The 40 week was pushed through this week so that is excellent!!!!!! The price action dipped below the trendline (blue) and turned up. Excellent. Immediately above are the 10 week resistance, the long term support resistance zone and then the $3.96- $4.00 resistance level. So plenty of hurdles to overcome, but you can only get through them in the order they line up on the chart,1 at a time. So these charts make me reasonably upbeat, however, so far, I am still cautious of this being just a bear market rally. We are looking at commodities,so we must go check the $USD. I have to use UUP to see Friday's price action intraday. The $USD chart only updates after market close.
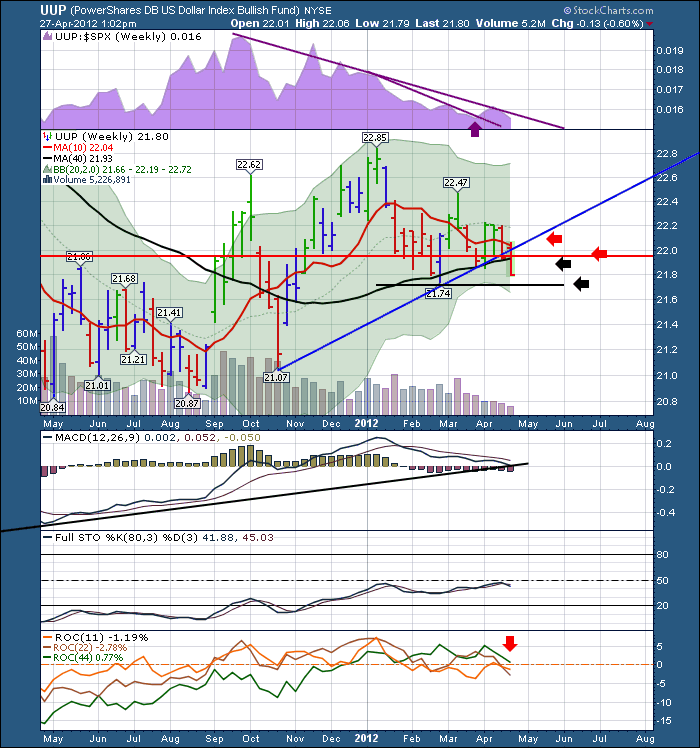
Here is the UUP chart.
The UUP chart is the ETF that follows the $USD. It just helps to see the price action each day including today.
Well here, the $USD has lost support of the downtrending 10 week moving average and it was overhead resistance this week. It is bearish that the 10 week ma is pointing down for the currency, but bullish for commodities. The long term average is still in an uptrend. This black line is the 40 week. However, the ETF price pushed down below the 40 week this week. We also broke down through the red long term support/ resistance horizontal line. We have one more support location to expect a bounce and that is at the February lows. The volume contracted significantly on this move down in the last 3 weeks. Is this just a head fake? Usually volume accelerates when things are moving down.
The last three indicators are simple. The MACD is at trendline support. That is important to see if it holds or fails.
The full sto's are trying to get above 50 but seems to be at resistance there. Lastly the rate of change indicators have all turned down and risk all three of them being below zero. That is bearish for the dollar and bullish for the commodity.
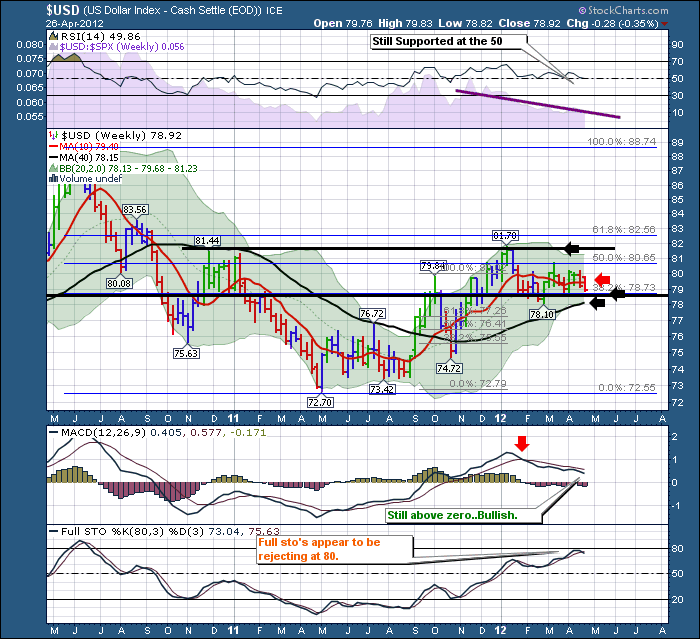
Here is the $USD chart for comparison.
That changes the picture substantially for me. The RSI is holding above 50 so bullish dollar. It could drop to 40 and still maintain a bullish posture. The purple SPURS is not helping because the last point on the right edge of the chart for a long trend line is the only place to rest the line, there are not really 2 points to draw the trend. If I use the larger trend it is clearly underperforming the SPX, and won't break through for a long time.. SO the line drawn is only for 4 months or else it doesn't really help here. Whatever, it has not broken out, but is is close to breaking out.
Lets cover off the black and red arrows on the price chart. Below the price is the 40 week, then the long term support /resistance line. This line is really important. It has been supporting the action for a while. The 10 week line has gone flat, so no help on direction but it is currently overhead resistance. Lastly, the January highs would be a hurdle to cross.
I also mapped the Fib levels in light blue. The 38.2% retracement line falls under the bottom black horizontal line. It is support. The price is just oscillating between the 38.2 and the 61.8 levels. After pushing up to 61.8 the price pulled back and has been riding between the 38.2% and the 50%. It still looks supported and bullish to me.The MACD is nice and high and the pullback is gentle and controlled. As an example, it is not freefalling like the weekly $GOLD MACD. Go have a look to compare. The sto's seem to have found resistance at the 80 level which can be a common rejection point.
In summary, I think the dollar still looks supported here. It makes me think the rally in $COPPER is just that. I'll try and post a powerpoint presentation over a few blog days that I presented for the Seattle MTA last night on my global market views. It is permeating my view on the markets as well. However, $Copper rallies have to start at a bottom sometime! Perhaps riding this rally could be the start of the next bull trend in commodities. Nobody would like that more than me. The one thing that doesn't really support the next bull market in commodities is that the miners have been so weak lately. Interestingly, this week they all snugged up to their 10 week lines, ahead of copper reaching the 10 week ma.
All that to say, its a directional struggle right here. A long copper and the miners could be an excellent rally point, but the $USD hasn't broken down and recent economic reports have not been bullish. Caterpillar was underwhelmed by the global outlook on its conference call. Trading this move with stops under it, could be the start of the next bull run. However, trading this without stops and you'll be run over by the 'Running of the bulls in Pampalona Spain". If it's not the bulls in Spain that take you down, it could be 'the rain in spain takes your stocks down the drain' - Dr. Suess action. That too could be painful. Or French elections, greek selections, dutch rejections, belgium wall erections....but I digress. Risk Management and profit management will be key on managing this trade if you choose to take it here.
Good Trading,
Greg Schnell, CMT

