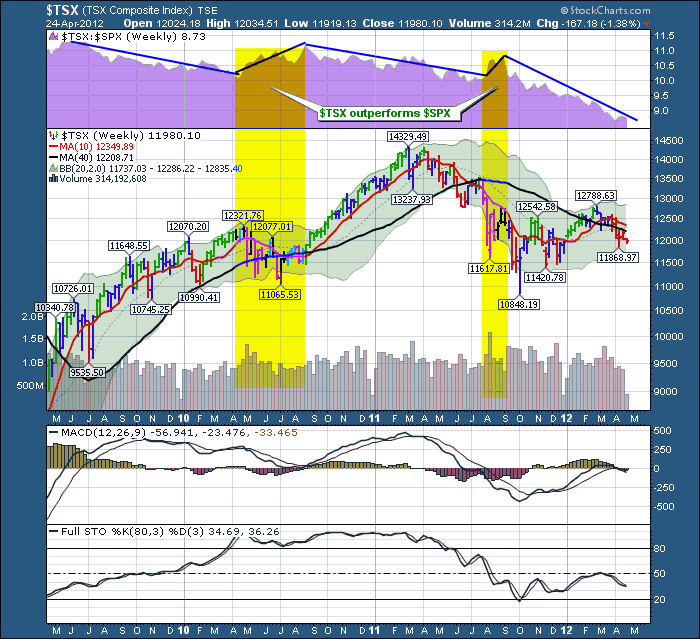
Here is a chart comparing the $TSX to the $SPX.
We can see that over the past 3 years the $TSX has outperformed the $SPX twice for any multi month length of time.
The purple shaded area is how the TSX performs to the SPX.
While the current market is in correction, patience is required to wait for the commodity sectors to start jumping. $NATGAS is obvioulsy under a lot of pressure. The inventory data from the EIA in the US is a big deal. Normalyl to FILL the NATGAS storage from March to October we add 2.4 TCF over 6 months. It is already 2/3 full. So some storage venues on the continent could actually be full dropping NATGAS to bizarre low prices.
Oil and Gold both have different forces, but they also continue to have downward pressure currently. This continues to squeeze the TSX.
Good Trading,
Greg Schnell, CMT


