Well, the Third part of a four part on Trilogy...Yep, the titles as confusing as the stock market!
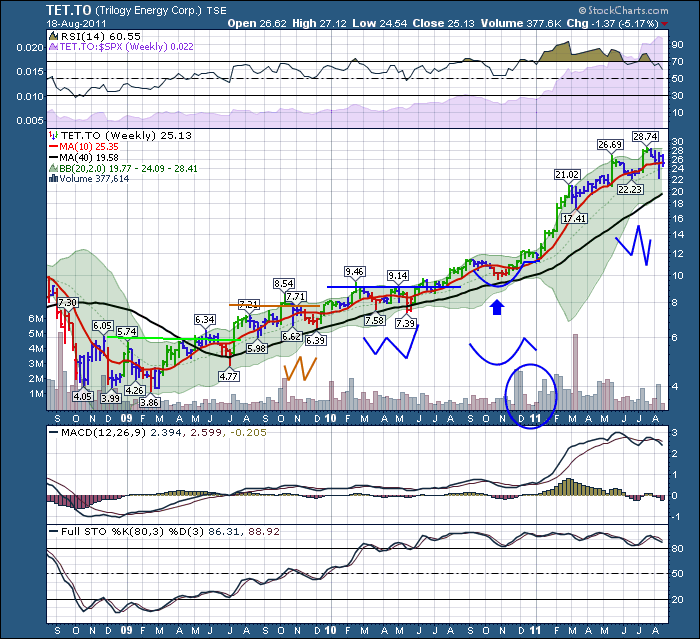
The Double bottom in 2009 and 2010 were strong patterns within a strong uptrend. It was an unmistakeable bull market trend on the 40 week, and Trilogy gave some buyers some incredible places to buy.
Look what happened in late 2010. Trilogy went on to create the Classic cup and handle pattern associated with growth stocks. It had pulled back from recent highs, creating a few red candles. As the right side of the cup was forming, look at the volume surge. In an often seen style, the stock broke out to new highs on high volume. Then it went to sleep. It traded in a very tight range, with a minor pullback creating the handle. But more importantly, look how the volume dried right up. The surge out of the pattern was euphoric as the stock doubled. There were a few things that made this difficult for technicians. At December 2010 the RSI was not making a higher high but the price was. The MACD was making a lower high as the price was making a higher high, this divergence would have got my attention. The surge to higher highs was a buy signal.
Then in the summer of 2011, the stock traced out a double bottom pattern again. 3 double bottoms in one stock. That sounds like a pattern recognition. All three of them had a right side lower than the left, taking out anyone with a tight stop. The Full Stochastics stayed above 80 for multiple years. The MACD was nice and high but some divergence showing up. The RSI had multiple lower peaks so this divergence was large, but the RSI had never visited the 50 line since October 2010. While the RSI was pulling back, it was still very strong. Notice the Relative Strength line hiding in the back of the RSI in light purple shading. Continuously climbing as it outperformed the SPX.
In the next blog, we'll cover the current position of Trilogy and some of the patterns and indicators. It's the conclusion edition, so watch for it in your mailbox.
Good Trading,
Greg Schnell, CMT
If you are thinking of attending the Banff Conference at the nicest Time of year, in one of the world's most beautiful locations, Click on the link below to get more information. Is anyone getting the feel that I am the organizer of the conference yet?


