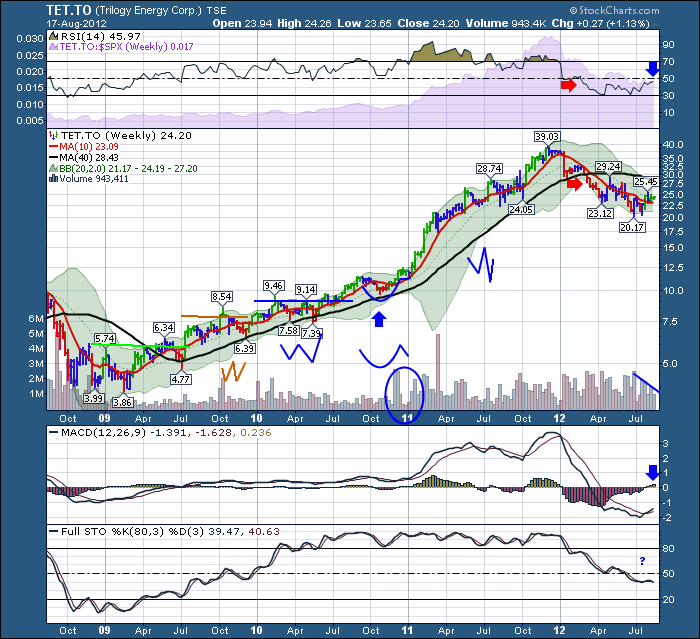
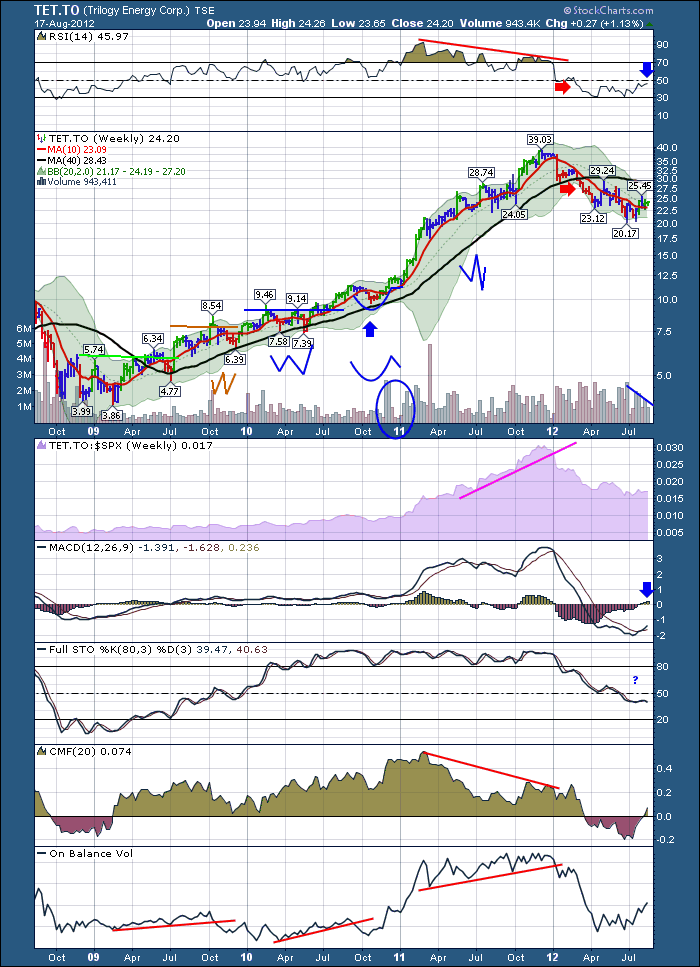
OOOUCHHHH!. Trilogy fell off a cliff and landed in the penalty box. Who could have seen that coming? Well, by studying the weekly charts I can't find any clues that a great growth stock was going to give up so much so fast. After the breakout from the fourth pattern or the third double bottom, Trilogy went on to new highs.
The stock was able to soar another 30% from the first new high in October and ultimately produced a higher high on the MACD but a lower high on the RSI. But we have seen that behaviour before where they disagreed. The reality is there was not a great exit signal, other than Alexander Elders work that suggests taking profits when it breaks outside your channel. I have the Bollinger Bands in the background but Elder uses a moving average envelope. Check the stockcharts 'Chartschool' for more information on those.
The 5 weeks going sideways with very little price movement and no volume would have been attributed to Christmas dolddrums. The smackdown in one week was clearly a trendchanger.
Gatis Roze, editor of the Trader's Journal blog, writes about using a 'sister' strategy.
Try and take stocks that are together in a sector and own the best. When the weak ones start to fail, tighten your stops on the best one. If it gets pulled down through your stop, you are out. He uses a great example of MA,V, DFS and AXP.
Well, if we used that strategy, it would be difficult as well here. Using CPG.TO, VET.TO, CNQ.TO, BTE.TO all rolled over on their own schedule. (Check out the chart of BTE.TO, Nice breakout last week!).
WHat else could we try? Well hindsight is nice, but something should work. OBV and CMF show interesting patterns. One of the great indicators is what I call SPURS. $SPX relative strength. It is the purple shaded area behind the RSI plot. Let's plot it in it's own box just to see.
I think all of the indicators showed weakness on each pullback to create a new base. I might suggest the most alarming signal was the steep slope of the SPURS (in Purple) to show a very strong stock. When that relationship started to change that was big. Secondly, If we remember January 2012, the market went on another EU rally do to the LTRO loans of $1 Trillion. The CMF being a lot lower as the stock runs up really does influence our decision in hindsight, but you would have left the stock in April 2011 when the energy sector pulled back in Canada. Seeing the sector strength plummet in Energy in general in 2011 might have been an exit for some, but Trilogy displayed so much power, it seemed to bypass sector weakness.
The price action on Trilogy had a flat top for multiple weeks. It was a sign of distribution as the institution would keep pushing the stock up and then sell into the rally. Remember, they like to sell at the top of the range!
OK. So the top was difficult to spot. What about now? Well, one of my favorite comments is that MSFT went on sale for 50% off in the nineties a few times. From the high to the low, MSFT had pulled back 50%. MSFT topped Dec 1999 and one year later was 70% off. It never reached the old highs in 12 years.
So what about Trilogy? Well, you have a great growth stock selling at 50% off along with many of the other energy stocks in Canada. Time to Buy? Well, the CMF is moving into positive territory. The OBV is accelerating, The MACD provided a bullish cross a few weeks ago, The Elder canadles are turning green on a weekly chart and the down trend line on the SPURS is being broken. The downtrend line on the RSI is also being broken. The stock trades above its 20 week MA (by one canadian penny!24.20 vs. 24.19) If you use Technicals for Buy and Sell signals, That a pretty big list of buy signals.
So to the moon with Trilogy? We don't know? But we do know it is basing here and if you like to buy breakouts, there are entry triggers showing up. A stop can be placed relatively close based on Elder. Lastly, you can add to the position if it starts performing much like it did in 2009 as it moves through different Buy Points.
Well, That is a four part Trilogy. We'll have to check back in a few years to see if continues the large move up. Fell free to send me comments about the blog at any time. If you enjoyed this analysis, let me know. If you would like to see more of this analysis style, let me know.
Good Trading,
Greg Schnell, CMT
One last shot. Please go to the conference page to find an outstanding International conference on commodity trading through the lens of Technical Analysis. We'd like to see you there!


