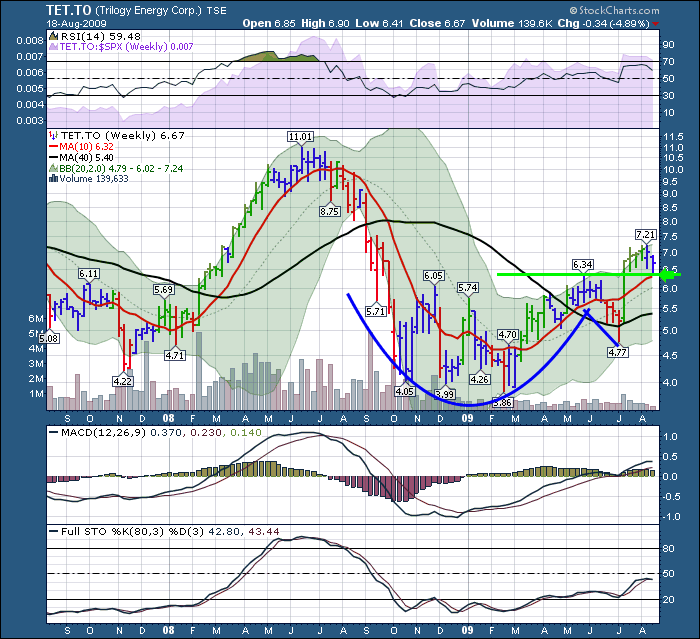
Let's just move off the global political spectrum today and analyze a very interesting Canadian Company. The Chart has all kinds of technical patterns, and we need to understand them. More importantly, how can we use stockcharts.com to make some money.
Trilogy energy knocked the shackles off its price chart on the move from the base below $5.75 to $40. Through hindsight, we'll analyze how to make this stock a discoverable, holdable, and profitable stock.
Here was the basing pattern in 2009. Trilogy kept finding resistance around the $5.75 - $6.00 level. Well as you can see, it broke above the $5.75 level and pushed up to $6.34. In a classic pullback called a handle, the weak holders are shaken out with a violent pullback. Dropping back to $4.77. But look at the week that followed. In one week, it took off to new highs on one of the highest volume surges in months. The base was built. The stock had broken free of the shackles and moved up. When people talk about buying breakouts, this is why. Something is changing in the stocks behaviour.
There were three different ways to play the base.
1) Buying at or near support. $4.00 Riskiest. But your stop would have been tight. It would have taken a few entries.
2) Buying a break of the downtrend line from $6.05 and $5.75. Probably would have got you in around $5.50 The ride was difficult from there as well as the base pattern built. But a series of Green and blue Elder candles had you up to $6.34. As you can see, the violent pullback (red elder candles) probably would have shaken most technicians out. Some of the best buying opportunities exist at shakeout points. We need to find them.
3) Buying a breakout above the $6.05 level. This also feels hard because the stock is already up 60% from the lows.
As it dipped below the 40 Week MA only to surge back above, we start to notice that some strong support is coming into the stock. Volume, new highs, etc.
On a kind gift to interested buyers, Trilogy came back to test it's breakout at $6.34 marked by the green line and pushed up. Not easy to hold as it is already 10% off it's highs. But definitely a location to look for support!
Two more things. Look at the positive divergence on the MACD and on the RSI compared to the price. While the price made two lower lows below the $4.05, the RSI and MACD were climbing. The MACD had moved into positive territory. Where do we go from here? Try not to look ahead, otherwise the drama will be a little less real.
Check back tomorrow for the continuing episode of The Trilogy.
Good Trading,
Greg Schnell, CMT
Hey, way down here... look down.. Have you signed up for this? Unbelievablely strong speakers. Click the banner link below for more information. If you can make it, you won't regret it.


