Last week we covered the $USD and $WTIC. Today, I want to continue on that subject and talk about what the long-term implications of US dollar breaking higher would be. Based on some of the other information with significant trendline failures, can we use this to help guide our bias?
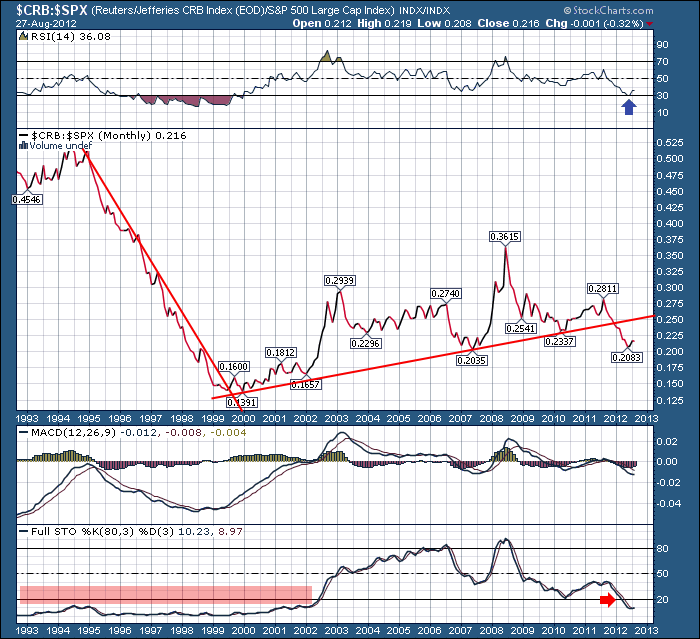
Let's talk about the $CRB Index compared to the S&P 500. This is a ratio of the $CRB:$SPX. Starting at the top, we have the RSI in a weak position. It's near 30 on the monthly ratio chart.
The main chart shows commodities massively outperforming the $SPX from 2000 to 2012. The actual peak was the blowoff top in 2009. The Trendline was broken a while back and blog readers might remember this from before. The MACD has made a lower high and lower low with no divergence. The Full stochastics are deep in the red and we got below the 20 level. In the 90's it stayed there for a long period of time. What does that mean to us now ? We know that commodities are out of favor after breaking this trendline above and usually that would surmise a rising US Dollar. That has not happened yet based on the 10 year trendline on the $USD.
However, with this ratio breaking down, it could be used in parallel to watch for a new push on the $USD to higher ground. That would mean that oil / commodities have probably seen the highs for a few years if this all plays out with the $USD breaking above the 10 year trendline.
Should the $USD fall, we would expect the $CRB to outperform the $SPX.
I'll be keeping this macro view in mind as we see this market close out 2012. This is monthly data so day trading blips are obviously ignored.
Good Trading,
Greg Schnell, CMT


