OK.
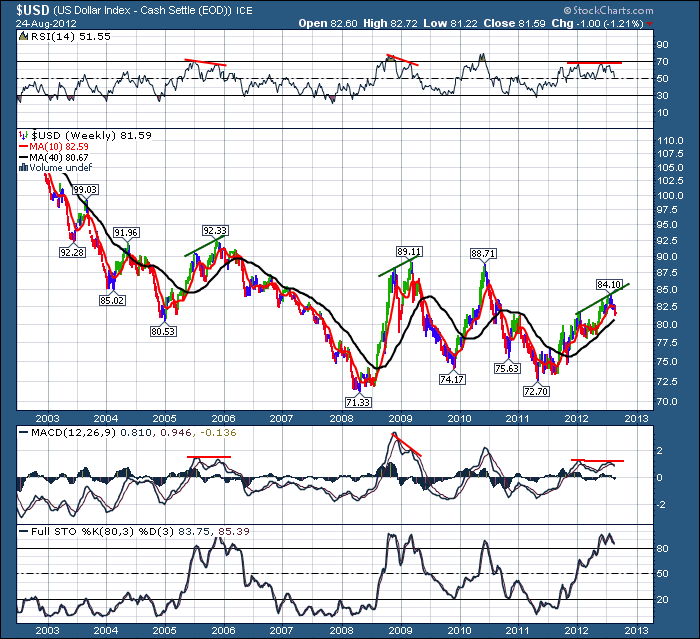
First of all, did anyone take the time after reading yesterday's blog about weekly timeframes to go and check how the move in 2005 played out with the negative divergence on the MACD? The real reason that the 2005 move interested me was that it had the same slope during it's advance as the current move. Anyway, it had an extremely similar pattern to the current pattern on the MACD. Technical Analysis is all about pattern recognition.
Definitely at a decision point. The $USD had a big down week last week, but the stock market was flat. $Gold took off as the dollar fell, but crude was up a marginal $0.35 cents on $98. Hardly shooting to the upside. $WTIC banged into the 200 DMA and a fibonacci level this week and reversed off that. So we are trying to surmise where this all leads to.
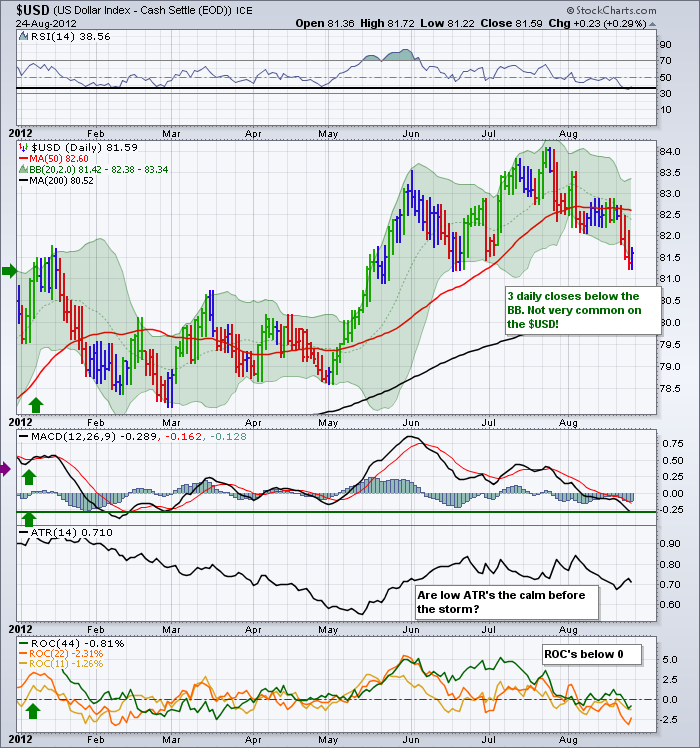
Well we have checked monthly and weekly $USD, It's time to look at the daily for clues.
Well, starting at the RSI. This level on the daily has been support. So I could really bet on the $USD long here and have a good basis for my trade on the basis on the weekly as well having so much support on it's chart.
The price action suggests an imminent bounce. 3 closes outside the BB is very negative. It says the mood is weak for the $USD but a least a reversion to the mean on the daily might be expected here. It is clearly trading below the 20 and the 50 DMA, but well above the 200 DMA. That is not news as we noticed the 40 WMA on Saturday's blog was below. They are roughly equivalent.
The MACD has turned at this level before. Again another line of support here. The low ATR might be a clue. You can click on the chart and go extend the dates back to see if a low ATR helps. Trying to make this more interactive and less reading!
Lastly, ROC's are all negative and I don't like going long when they are all negative. I want at least the short term to turn up! But a trade outside the lower BB is probably not going to produce anything turning up. We already talked about the horizontal support and resistance levels on the weekly.
For those who can't look back on the ATR, there was a top marked by a low ATR, but mostly bottoms. It just happened to be September 2010, and the first Fed QE program!!! Sound familiar?
I would say the data tilts heavily to a bounce here. But we are definitely at an inflection point of large scale. If the $USD starts gaining strength relative to the Euro and the Yen, This could be a vertical move. If the Europeans can put some magic together, the Fed introduces QE, we could see a rush out of the dollar into a risk on trade. I have no solution for Japan other than a lower Yen which would be what happens if the $USD strengthens and that would be opposite.
Obviously, the next stage of analysis would be to go look at each of the alternate currency charts. I'll leave that for others to do.
I expect the dollar to bounce in the short term, and then we'll play it from there. It is definitely at a major trend change on the chart either breaking above the monthly or below the weekly.
Good Trading,
Greg Schnell.


