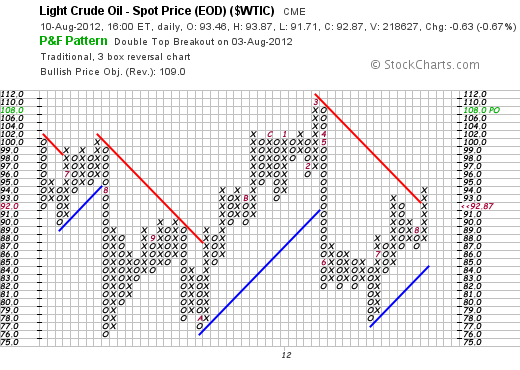
Last week The Oil Pnf Chart started the month on a column of O's. I wrote about it in the Chartwatchers newsletter. You can find the link here. Chartwatchers
The chart immediately reversed to the upside. What a beautiful bounce off support.
You can see the auto calculation from the PnF sits at $108. Ultimately, that is where we would expect to see the chart climb to. It does not mean it has to do it in this column. The downtrend has been broken. Very nice breakout that should give us some room to the upside.
There is still room in the conference. We'd like to see you there.
Good Trading,
Greg Schnell, CMT

About the author:
Greg Schnell, CMT, MFTA is Chief Technical Analyst at Osprey Strategic specializing in intermarket and commodities analysis. He is also the co-author of Stock Charts For Dummies (Wiley, 2018). Based in Calgary, Greg is a board member of the Canadian Society of Technical Analysts (CSTA) and the chairman of the CSTA Calgary chapter. He is an active member of both the CMT Association and the International Federation of Technical Analysts (IFTA).
Learn More


