It is important to keep the very big picture in mind. The phone technology seems to be balancing out across the world. The competitors to Apple are able to compete now. The iPad is significant, but there are now lots of choices on the market. I own so much Apple hardware, I would have to rank as one of their biggest bulls. I don't look at Samsung, Microsoft, Nokia, Motorola, Google for my hardware as I am enveloped on the Apple ecosystem.
One of the big things that hedge funds like to do is keep a big stock as a maximum % of total value inside their portfolio. So as Apple surges to new highs, they continue to trim the number of shares. That forces them to reduce the number of shares at the top, and add to the number of shares at the bottom. This is typically the opposite of retail investors. Retail investors want to hold their winners and allow them to get too large a percentage in the portfolio. Then when they pullback, they buy even more. Then it falls really hard and they are afraid to sell.
As a Canadian, we have had some huge swingers. Nortel was 33% of the $TSX and went to zero. RIMM was a bright light. Jim Balsillee hadn't even looked at the iPhone after its huge debut. Now he is no longer driving the RIMM corporation, and the stock has gone from $140 to $7. I have mentioned MSFT all time highs before.
So what is a technician to do?
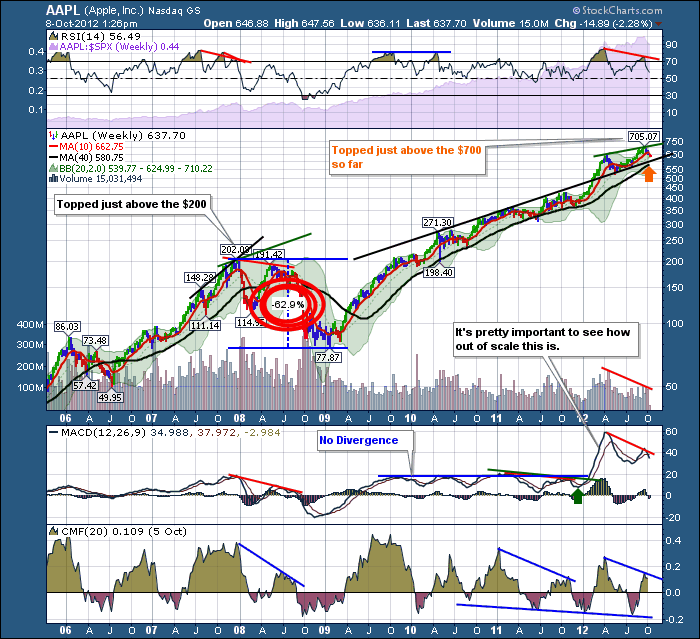
Look at the weekly. If you haven't already, that is a minimum.
This chart mirrors the 2007 top. The stock was in a strong uptrend in 2007. Black trendline. Apple continues to make new highs but the MACD rolls over around Dec 2008 well after the overall market tops. Green trendline (drawn extended). Then the MACD trendline pulls down hard and Apple tries to make new highs. It stalls at $191. It is also important to notice the MACD was making a higher high than the years preceeding. Apple trends were stronger than the overall market but basically Apple fell as the market rolled over. October 2007 high, December test of the highs, and May had a lower high.
In 2011, Apple showed a bit of negative divergence in October 2012. Remember that Apple was pulling back with the overall market. The MACD rallied from above zero and went on a monster surge. I remember being worried about Apple then. That positive turn was very important as it was in the overall market.
So what's different this time.
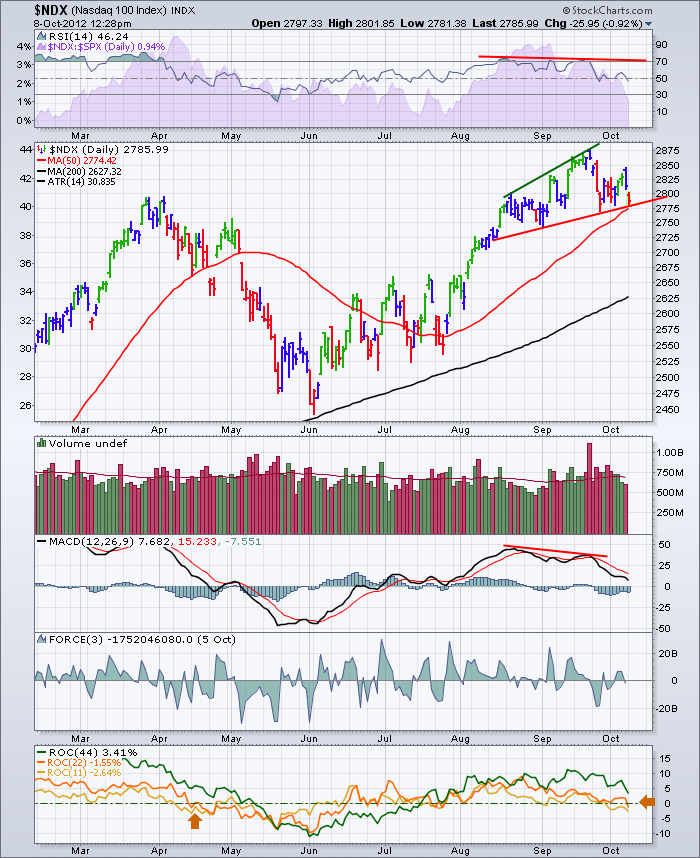
Well, Lets start at the MACD because that is the best picture. The MACD made a monster size move. This was clearly out of scale. Excellent. The real problem is that this exuberance has quickly faded and the MACD is making a lower high. This is divergent from the price high. What is important is that now Apple is off (only 9%) from the highs but the Stock market is sitting at 4 year highs and the NDX is well above that in the order of 8 or 9 year highs.
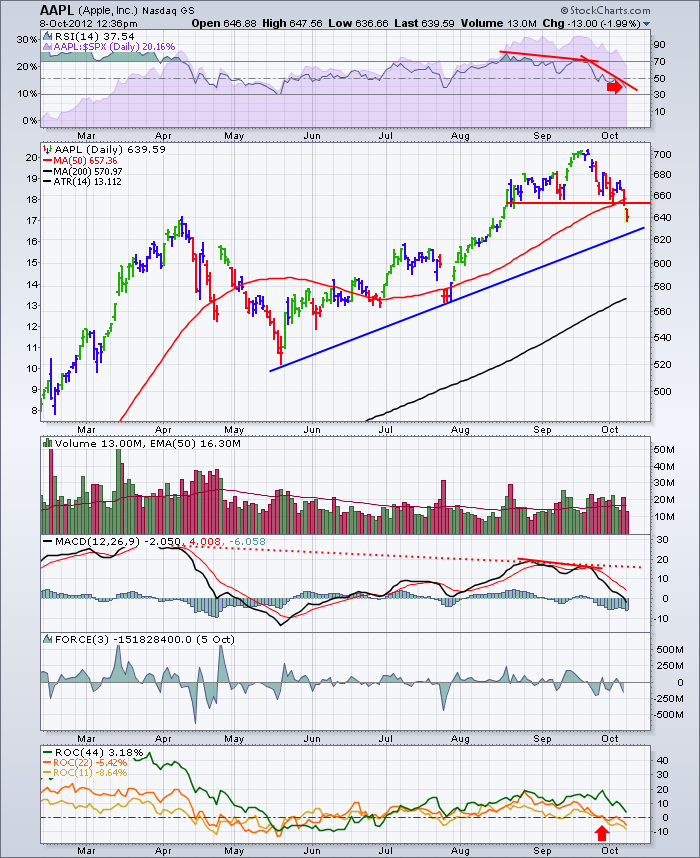
So a few things bother me. The RSI is confirming the divergence on a weekly chart. You can also see that Apple is losing on the SPURS *(shaded purple) behind the RSI. It broke the major uptrend. That is very important in my mind.
As the stock market piles up distribution days, it is not good that Apple is now leading the trend lower rather than having so much power that it outperforms the market at tops.
The CMF is showing more money coming out of Apple each time. That is not a surprise as that is what smart money mangers are supposed to do. The fact that Apple put much less volume on the recent high, compared to the April high, suggests this stock is near its final run.
The actual price extended well above the black trendline for a long period of time. If Apple loses this trendline, it would be a very significant time.
You may remember how the market loved Mark Hurd at HP. Now it hates HP. The loss of Steve Jobs at Apple is starting to show. The change in management with an accountant leading the charge is obviously worth watching. The sentiment from MacDailyNews towards Apple Management tells me all is not well inside the Apple fan base. The recent change in store employee strategy was classic 'back to normal' behaviour. Apple had been able to outperform by thinking differently in their retail strategy. Moving back to typical retail makes this look more like a Turkey on Thanksgiving. Traditional.
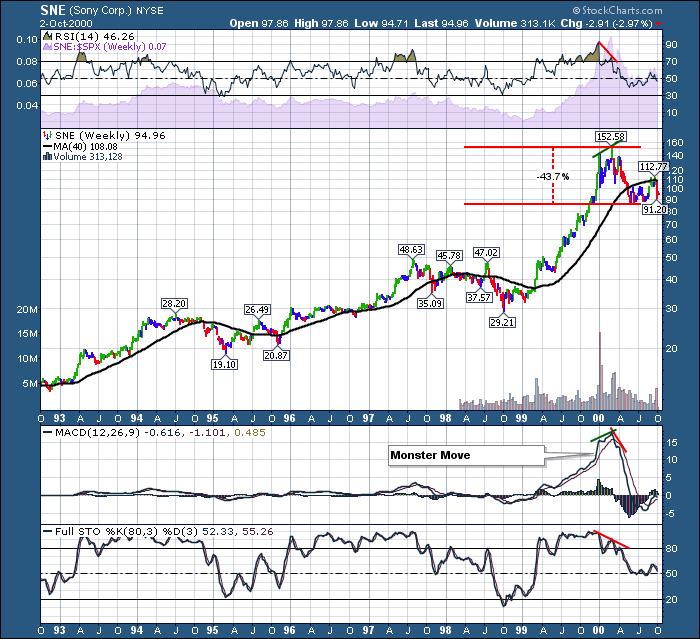
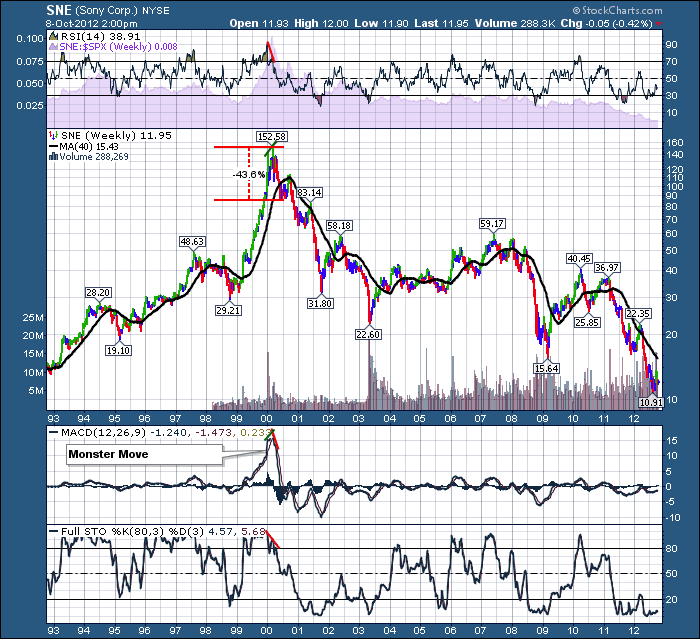
Having 3 home run products in a row is one of the greatest achievements of any corporation globally. Remember when Sony dominated TV's and personal Walkmans. Let me put up the chart for you.
Let's look how it ended for Sony now.
OK.Maybe for Apple it is different this time. Think Different. Remember the Superbowl 1984 ad? Well, the 30th Anniversary of Think Different is January 2013. I think it might be time to think different again.
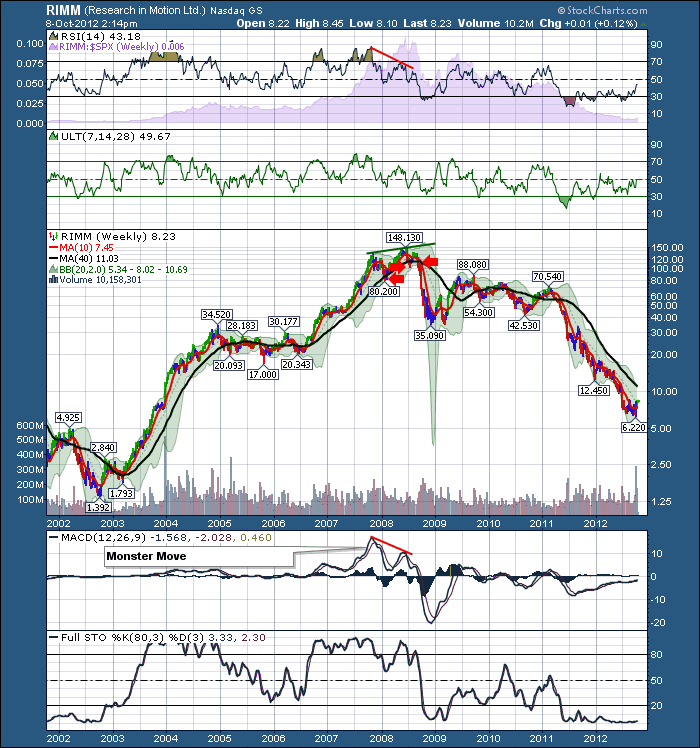
Here's a reminder for how it worked out on RIMM. See any similarities?
Ok this should officially kill any readership loyalty I had around Apple and will probably double to prove me wrong. What I am suggesting today, is that when other companies have undergone similar stellar moves of worldscale proportion, the fall can be fast and significant. Shareholders get to decide on which direction it moves from here.
I'd have charted Enron, WorldCom, and Nortel but there are no charts.
Here's a link to a great stock that no one talks about. From $1.56 to $1227.38 and back to $2.01.
See if you can mark the Monster move on the MACD and notice if the MACD had a lower divergent high.
Good Trading,
Greg Schnell, CMT

