Sometimes, the market seems to need time to sort itself out.
Check out this daily chart of the $SPX.
Various clues over the years get added into an analysis. Investors Business Daily likes to look at where the market closes each week relative to the high low range for the week. In simple words, was it a strong week, or a weak week? You can do that analysis on a daily chart as well. Dan Gramza does this with daily charts.
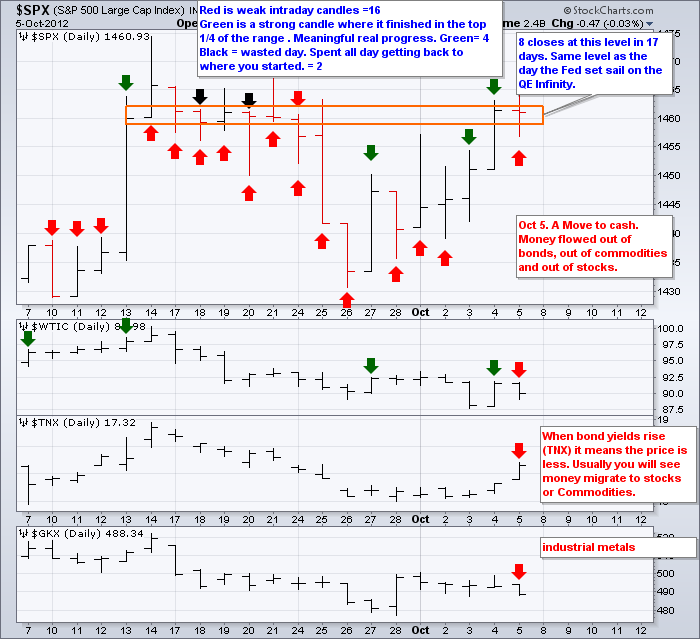
As the markets roll, you look for progress. Typically, retail investors jump into the market in the morning, and institutional investors use the last hour to take positions. So what does it mean when the market can not maintain the highs of the day? The last time we closed on the high of the day was September 7. That is not shocking one way or another, but it does mean we haven't been buying into the close for one month now. We still have some intraday surges to get us back to unchanged. There have been quite a few of those. Some would call that the Keynesian invisible hand. Doesn't really matter what is causing it. It is indecision.
Almost like an old farm water well, you stop pushing the handle down when water stops flowing out rapidly. You lift the handle up which stops the water flow briefly and then with another push you make more progress. Well, in this analogy, we have done a lot of pushing but the market has gone nowhere. No new water in the bucket. No new highs in the market. We have had 8 closes in 17 days within a tight range right at the level of the Fed's QE Infinity announcement. The directions the arrows point on the chart are not relevant. They are just highlighting a strong versus a weak candle. We have only had one close higher than QE day and that was the following day. Since then, everything up at that level has created a selling tail on the daily wick above the closing price. We have had 2 days (in Black) where the market sold off in the morning, only to spend all day getting back to where we started. That is analogous to starting with a bucket full of water, spilling it, and spending all day getting back to the full bucket.
So we are clearly restesting the highs, but there are not a lot of institutional investors buying in to keep the market at its highs as we go into the close each day. Friday was classic. Unemployment dropped .3% in a month. That should be so bullish. Finally under 8%!!! You can hear the thunderous BUY BUY BUY yell coming. Market surges up in the first half hour and recedes all day, with a little short covering to close the day.
The Canadians were heading home for the Thanksgiving long weekend, but that would not account for the total lack of buyers on good news. We had a surge of new highs on the NYSE but the SPX closed near flat.
What is the market telling us? It all seems so confusng. Why don't we just buy a gazillion shares of Wells Fargo to ride the MBS market that the Fed has promised to buy? I don't know.
Daily
We have the stocks ($SPX) in the first box. Lets look at the oil, Bonds and Industrial metals.
Oil has only had 4 green arrows including the day where the market last closed on its high. On Friday, oil sold off after a recovery rally on the previous day from the selloff the day before. Sounds like indecision. So three real advancing days in 20 including Ben's day.
The Bonds are next. If we are all bullish on the market, we sell safety and buy company stocks that go higher. Well, the YIELD went higher on Friday, which means the price of the bonds went down and it was a sizable candle for the day. The bond selling continued most of the day as you see the TNX (yield) finished near the top for the day.
When they are selling bonds you want to see the money move to commodities or stocks. Well, we didn't see that either. All the commodities had a selling day. So was it just a move to cash for the day? Out of stocks, out of bonds and out of commodities? These days do happen but not usually on a breakout day to near 4 and 5 year highs.
What is the problem? Well, there are the always optimistic bulls saying everything is rosy. There are the always pessimistic bears saying everything is phony. The real question is everything is ending in 'Y'.! Why are we so worried at these levels? The distribution days have been piling up. There is a lot of churning action which means little progress higher. A surge to take out the shorts who have set their
stops above the previous highs seems obvious, but even todays bullish employment headline number couldn't do it. Rather than let the euphoric New highs and BUY BUY BUY signals get us all twitchy, lets watch the price. Right now it is stuck at cautious.
More on some cycle analysis over the next week.
I'll be at the Stockcharts University course in NYC on Saturday. Feel free to introduce yourself if you can make it. Its nice to meet the readers of the blog. For more information on the conference, follow this link. STOCKCHARTS UNIVERSITY. Click on the NYC button at the very bottom to register.
Good Trading,
Greg Schnell, CMT


