I want to talk about using PnF today. Point and Figure (PnF charts) can be found at the bottom of your regular charts. There is a hyperlink to take you to the PnF chart.
Recently, at the Banff Conference, David Keller of Fidelity spent a substantial part of his presentation on PnF charts and how important they are in Fidelity's technical work.
Sooo, I got to thinking, if its good for managing 1.3 Trillion, maybe my account could use some PnF. Just sayin'....
Well, below is three different PnF charts tracking the same thing. The Price of Oil.
Let's analyze how to change the parameters on $WTIC to reflect the different look on the chart.
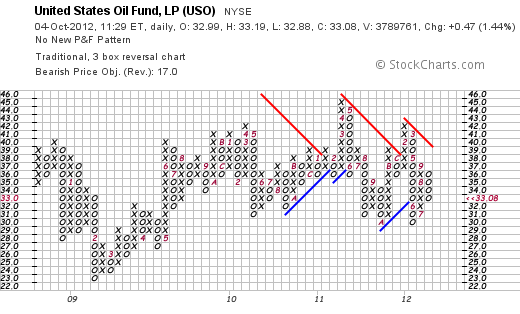
First of all, Here is the updated USO chart from yesterday's trade with some of today's trading. 11:30 NYC time.
Remember the numbers in the boxes are calendar months. Jan=1, Sep=9, Oct = A, Nov =B, Dec= C. This is not where the price was on the first of the month. It is where the first box was added in the new month. So no new box has been added yet this month. But roughly this chart is about $3 of $WTIC to $1 of USO as Crude is about $90 and this is about $33 for this discussion. When we look on the $WTIC chart, it will look different.
Go slowly through the above paragraph. Hopefully that makes sense.
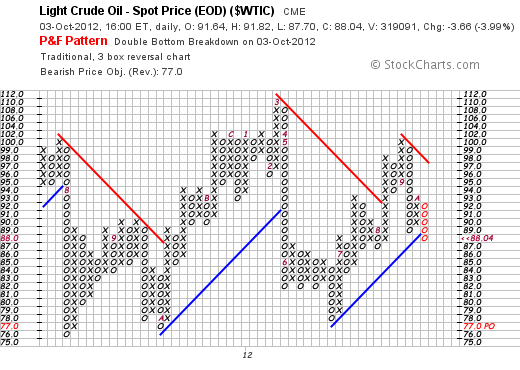
Below is $WTIC. Does the chart look the same to you? It looks way different to me. The reason is the sensitivity. Crude is using a $1.00 box size, where the USO is using a $1.00 box size as every ~$0.35 is one dollar in $wtic. The $WTIC does not update intraday. So, below is $WTIC.
Now look closely. You will notice $WTIC crude put an "A" on the top of the column of x's. When crude moved down yesterday, it created a column of O's by changing more than $3.00 from the previous high. So this is more sensitive. The columns reverse sooner. To make the same chart on USO we would have to set the box size to approximately $0.35 instead of $1. The important thing to see on these charts is where is horizontal support and resistance and where is the bull market (blue trendline) and the bear market (red Trendline). You can see on $WTIC chart above, we fell below the bull market trendline that has been in place off the June lows. We know it was June because the 7th month (JULY) was marked in the rising column of x's near the top.
OK. So let's finish our analysis on this $WTIC chart above (Chart 2). Looking left, 4 column's of x's going up stopped at $93 or $94. That is resistance. 2 columns of O's going down found support there. That was support. So we are under this support/resistance line at $94. We have started a bear trend by breaking the blue line uptrend, and now we are looking for support areas below. This $87-$88 area has had 2 column's of x's stopped rising from below, and two columns of O's found support there. So we are at a level of support. It could also be said that we are holding onto the blue line and bounce off it back to the upside from here. Technically, it has broken through, but occasionally it does test one box lower, reverse and shoot higher.
If that breaks, downside targets would be $82, and $77. Can you see the reasons based on where columns hit support and resistance? Mathematically, based on how to measure PnF targets, the breakdown has a pattern measurement of $77 that you can see on the lower right of the chart in red or up in the Header information. The signal as mentioned in the header is the Double bottom breakdown. So when we went lower than the last column of O's, it used the signal to calculate a target based on the Pnf Columns above. See the Chartschool tab for calculating PnF targets.
On this chart is it easier to see why the $100-$102 area was resistance than the $36- $37 area on the USO I mentioned yesterday? 6 Tops of 'x' columns stopped at that level. One stopped just below at $98. I would suggest that $WTIC has a very hard ceiling at $100 and will have to find some serious energy to get through it any time in the near future.
Lastly, Let's try to replicate the USO chart with the $WTIC chart by changing the box size.
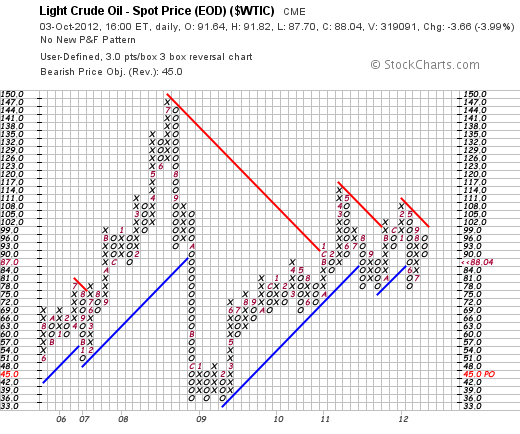
Change the traditional to 'user defined' and set the box size to $2.00 instead of the $1.00 it was at. Hit update and you should see this chart.
Well, that is closer looking. Now we'll try $3. You can see the chart brings in much more data going back to 2005/2006. This chart shows clear support at $78 with the column of o's stopping there 3 times recently. The next major level would be $69. You can also see with the chart setting it changes the price objective to $45 down on the right hand side. Well, we have changed all the base parameters, so I am not comfortable using a target off this chart setting. But I am comfortable saying that there is major support at $78 and $69 if this $87-$88 level we are currently at doesn't hold.
I hope that makes sense for everyone. How to use the PnF charts to spot support and resistance is very easy. Who knows, maybe you can outperform the big guns by using some of their weapons to attack the market.
All the charts should be clickable. Notice the way you change the settings is to select user defined rather than traditional. If you want to be more sensitive you would change the box size to $0.50 or $0.25 and then you would be seeing radically long columns of 40 x's or O's when the price swings $10.
So whats the bottom line? Support here is possible but very weak as it has 'broken' the trendline. A break down would drop another $10 to $78 where there is a very hard line in the sand. A break through that would obviously be very uncomfortable at $69. Currently we are at a support level where we can watch and see if it can bounce from here.
Good Trading.
Greg Schnell, CMT


