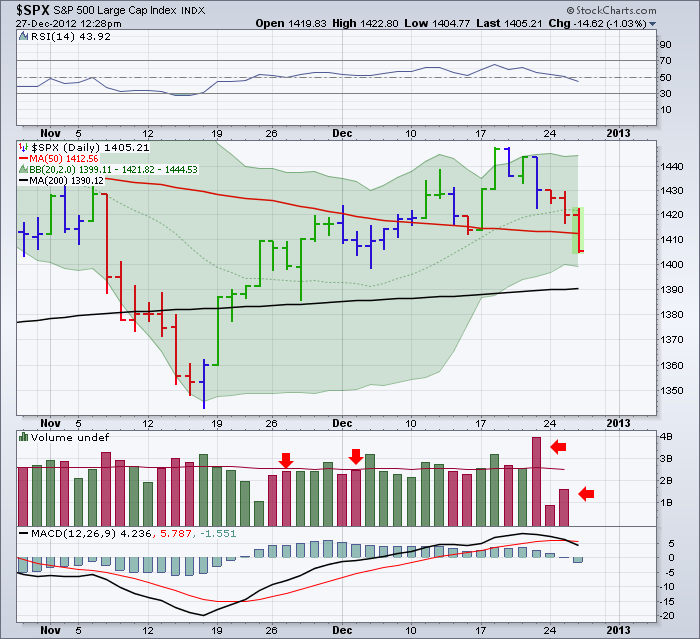
Here is the $SPX. A few weeks I wrote a note about how the globe was turning bullish, and we should watch closely. If the world does break out, its time to get long. That blog can be found here. Bullish. I would encourage you to read the long blog.
So lets check on the update to see where we stand. This current market is showing a new hand.
Let's review some of the indicators.
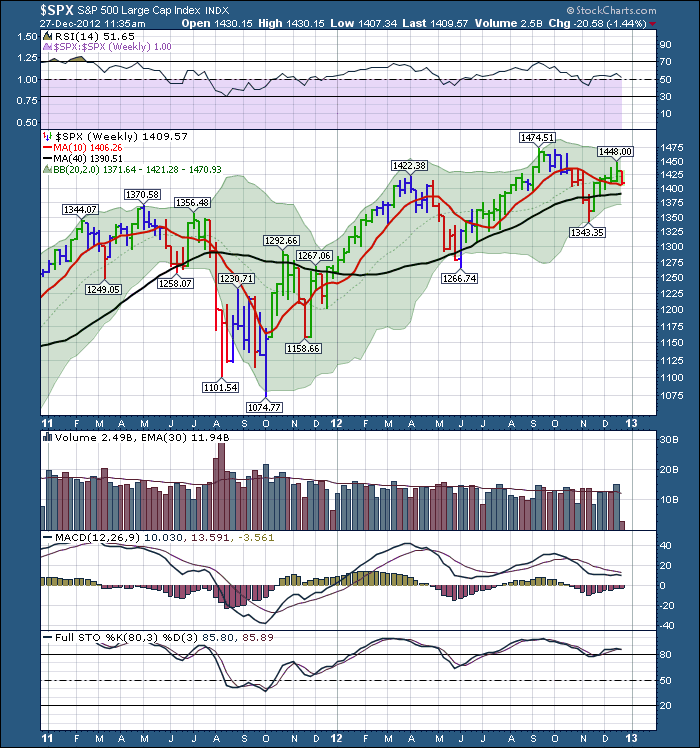
The RSI is struggling to get above 60, but nothing real sinister here. Although the price got to within 26 points of the high, the RSI was quite a bit lower. How about the MACD? The March high was the highest peak on the MACD but not on price. Then the September peak came with a lower MACD but a higher high in price. This is what we call divergence. Very concerning. Now we have another lower high on MACD but price is also lower. This is the critical POINT on a Head/Shoulders top. If the market can not push back up here to the upside, this is when we need to exit. The Full sto's have already crossed the signal line.
More alarmingly, look at the volume on the $SPX chart. Last week going into Christmas we had one of the biggest volume weeks of the year. It was definitely a top 10 week. Now let me tell you when we had bigger volume than that. The week of September 14, the Week of the July breakout and early March at or near the top. Now look at last weeks volume compared to last December's Volume for the same week. The volume was well below average last year, this year is was one of the highest volumes. When everyone is supposed to be shopping, it would appeart the large funds were doing some selling. To have a substantial volume change of that proportion is not good when things should be quiet.
What bothers me? Being on the other side of quite a few technicians. Having the $SPX hitting this firm resistance area right here. Having the market pull back at resistance on a Fed week. That caused a top in September. On the charts above I selected areas on the charts with horizontal support and resistance. The $RUT is at 825. This level has been a problem all year. The poke above in September unwound quickly. Now we are testing it from the bottom side again. I am not bothered by the fiscal cliff. Global trends will outweigh a couple of government tax grabs. This wouldn't be the first time we have had a tax increase from government!
So, I'll continue to watch. Perhaps this all falls apart. But at the current levels, this looks very bullish. Follow along with me over the next few months. If it's true, stop shorting and find great stocks to get long. Should this all fall apart, we can reverse course. At least we have a line in the sand to work against. Right now, I'm bullish. Things can change for the worst, but my data just turned positive. I thought I would share it.
More remarkably, I think I just turned bullish for the first time in 18 months! Its been a long slog!
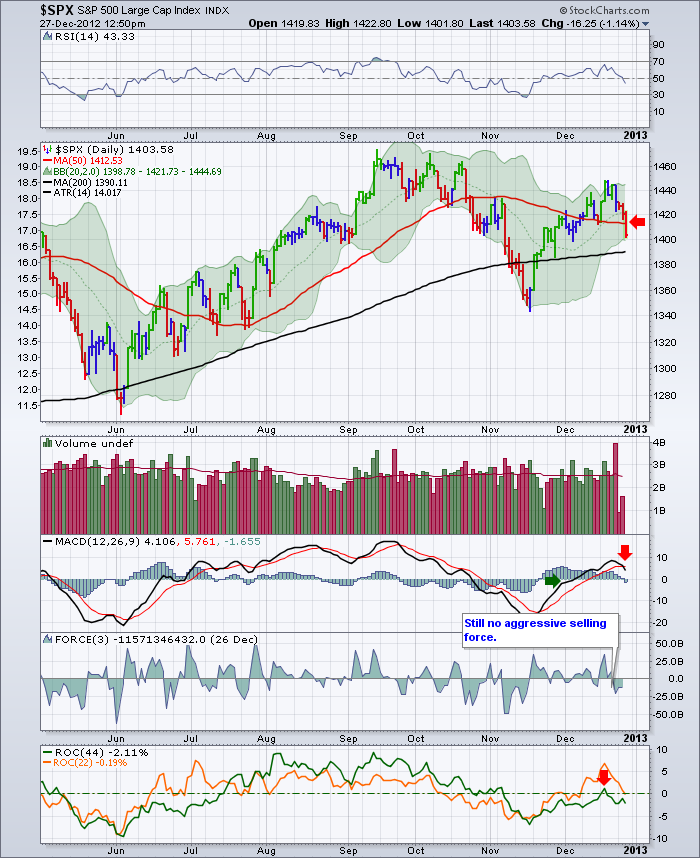
Monthly candles are long candles. They cover a lot of price levels in a month. This call won't help on 1% and 2% down days, but we are not seeing a lot of distribution days either. That will be a clue for me if this isn't going to hold. First stop is getting the $SPX to hold solidly above the 50 DMA! Today we closed above it again. One of the major issues technically, is the $SPX is currently at the height of the left shoulder in a head / shoulders topping pattern! We need to clear this so it doesn't complete.
So my lines in the sand are:
1) $SPX stays above the 50 DMA
2) $TRAN breaks out on the weekly chart.
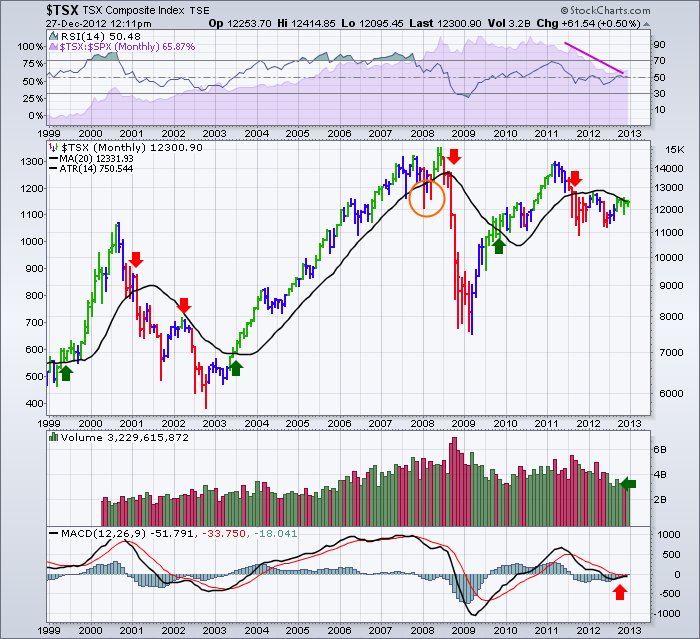
3) $TSX stays above the 20 MMA.
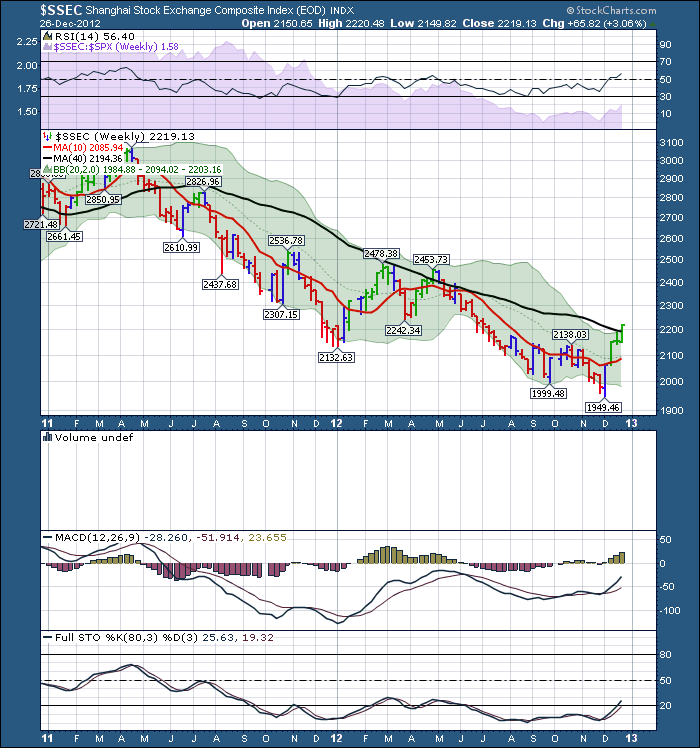
4) $SSEC continues to improve
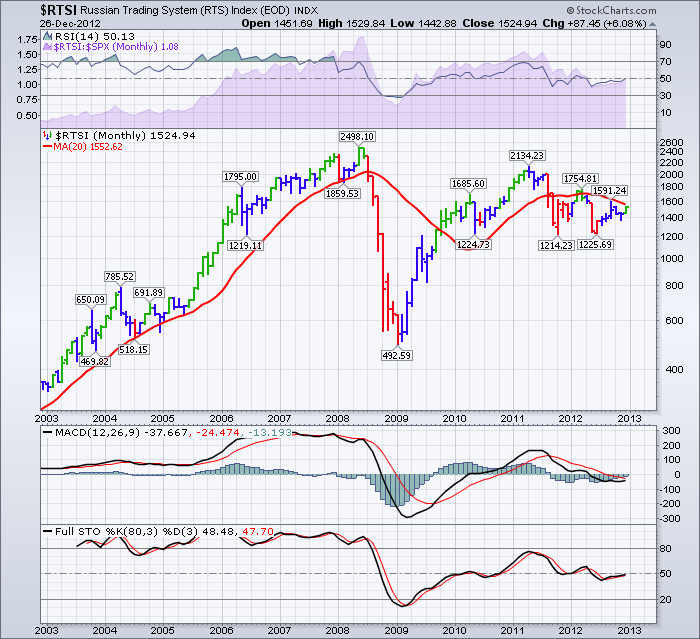
5) $RTSI - Russia joins as well. Hopefully before December is out.
6) Continued upside moves without a collection of distribution days in the near term!
So lets check my list for a new bull market.
1) $SPX above 50 DMA. Looks like a fail today. Fail.
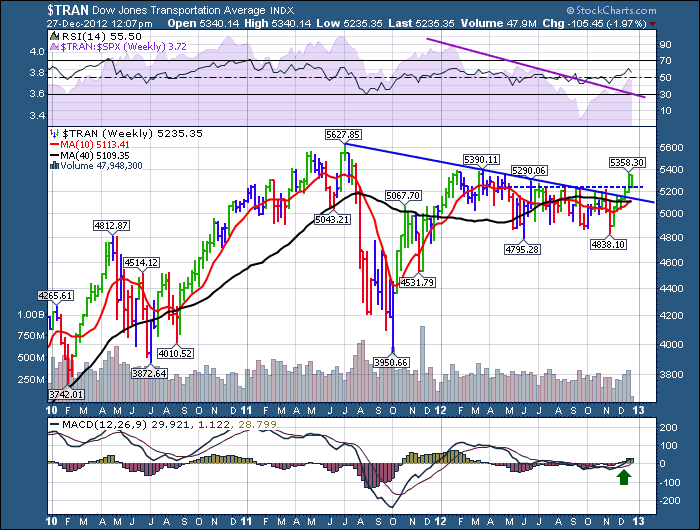
2) $TRAN. Broke out, and is now retracing back to the breakout level. I would move to caution at best, as the breakout failed to keep going higher after trying to get above the trend line and horizontal resistance. Passing grade for now.
Has Failed to hold 12331. Fail.
4) $SSEC continues to improve. Pass.
5) $RTSI. The 20 MMA is at 1552. The Russian market has not made it above there yet. But it has improved for the most part in December. Fail.
6) continued upside moves without distribution days. Another Fail.
A distribution day is a meaningful down day on higher volume than the previous day. Today's volume is not on the chart yet, but it is tracking meaningfully higher. WE HAVE 3 DD IN THE LAST 4 DAYS including today. That is a big problem. The institutions are selling their holdings here.
So, in review...
4 of 6 moved to a fail. and transports appear to be close to holding the breakout. That would be another fail. This is a problem.
Note the line from the 20121212 posting.
One of the major issues technically, is the $SPX is currently at the height of the left shoulder in a head / shoulders topping pattern! We need to clear this so it doesn't complete.
Unfortunately, we have to switch to caution mode.
Good Trading,
Happy New Year!
Greg Schnell, CMT

