After topping my coffee this morning, I started reviewing some charts. Some interesting charts in Europe needed more review. Lets work through them today.
As an aside, one of my favorite paraphrases comes from Jim Cramer about the European markets.
"I hate waking up in the morning and checking on Europe. I have no network to check on the underlying."
So why is it my favorite? Because most of us are not Goldman Sachs alumni, nor do we live in the Metro Manhattan area with rolodexes of hedge fund managers and CEO's to check in with on the US underlying. Jims weakness is our weakness every day. I rely on the charts for my perspective. You can make your own call on my comments, but hopefully this chart collection helps you to frame reference points on investor attitudes towards Europe.
OK. Back to the Cappuccino review. The 5 countries below have populations around 60 million each so this is a pretty valid look from my perspective.
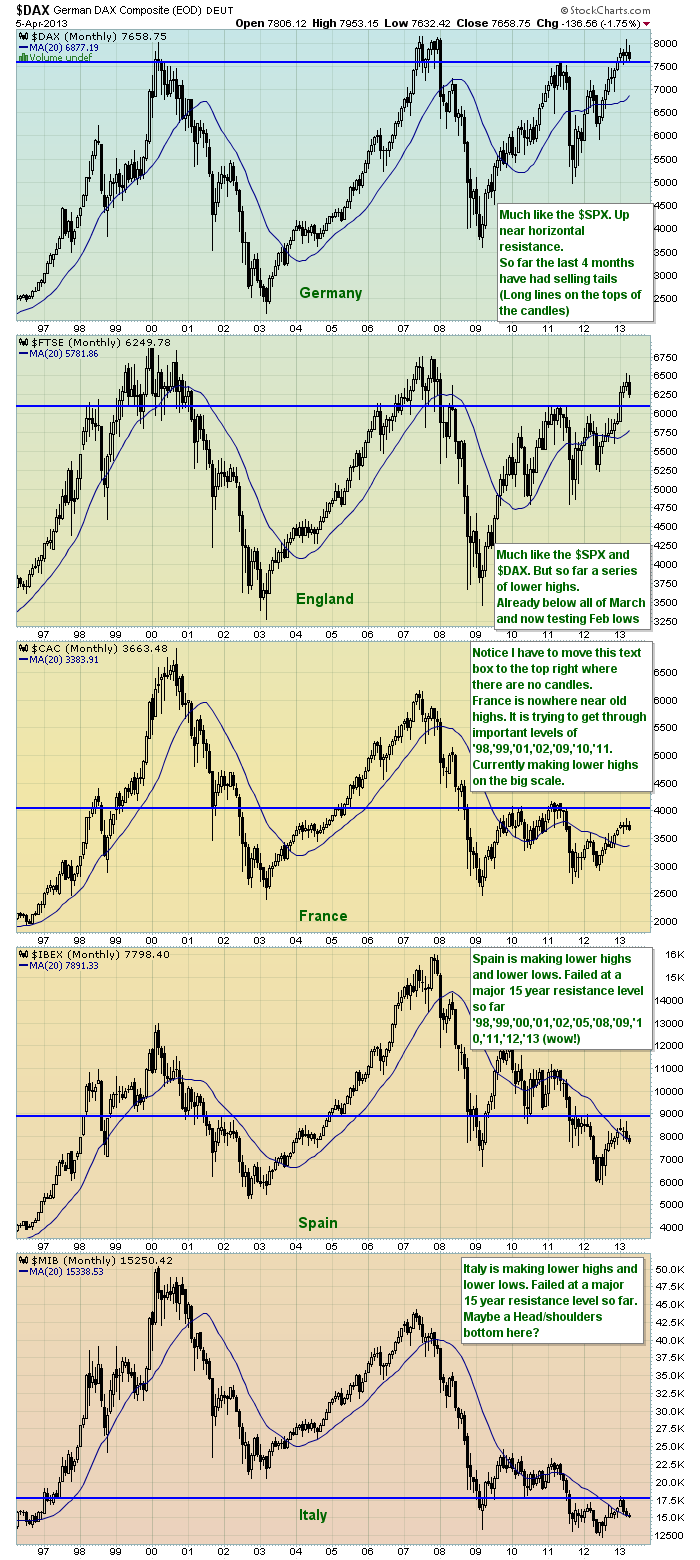
A quick view of the Monthly..Just setting reference levels.
So what do I notice on the really big picture? Just scan the right 1/2 of the chart and scroll through them.
Germany is tracking the US in terms of the 'developed' world. However, everything else is lagging.
The recent surge by England is encouraging, but most of that was the Pommeling Of The Pound currency war. An occassional event? France is still 10% below the 2011/2012 highs. Spain has bounced off the lows, but is stuck below a major horizontal support and resistance level. Italy appears to be trying to get above the major resistance level, but so far is unable to.
Regular readers of the blog will remember my love for monthly charts to be above the 20 month moving average. (20 MMA). Notice both Italy and Spain have now dropped below again as you can see in the top left legend on each price plot. The 20 MMA is important in my work as it identifies when we started global bull markets in 2003 and 2009. Recently in December the whole world was above. Now 6 nations have fallen back below if we include Spain and Italy. Canada and South Korea tested at the 20 MMA on Friday. South Korea closed just below on Friday. So Shanghai, Brazil, Russia, South Korea, Spain and Italy are currently below.
OK, back to the Cappuccino review..
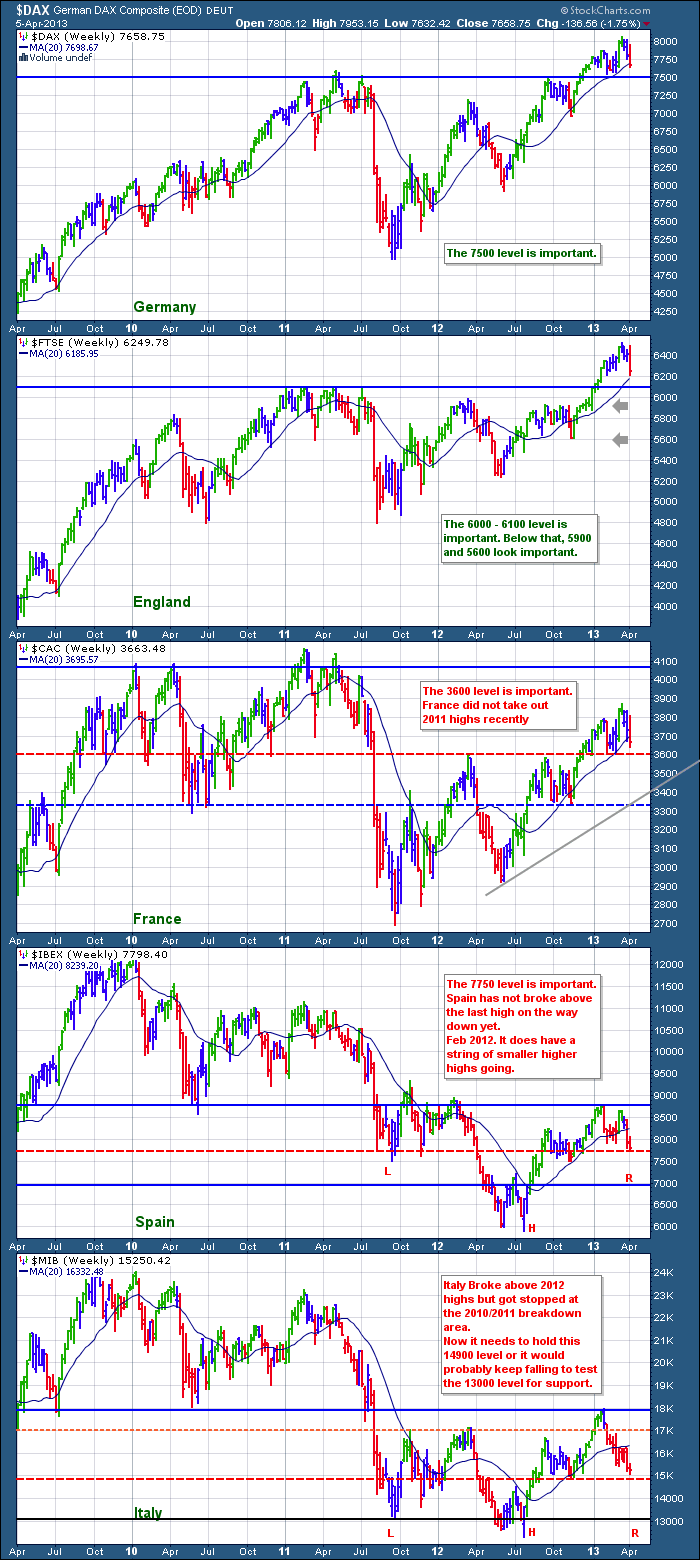
Lets move to the weekly. Do another quick scan of the right 1/2 of the chart.
Did you notice a style departure as you reached the French chart? The left side highs are not being tested. But the previous year highs have been broken above. Instead of being in the top right corner of the chart on the 3 year chart, France is only around 2/3's the way up. Spain and Italy are stuck below the halfway level. It is interesting to me that the macro perspective of 15 years contuniues to be similar even on the shorter term. A fractal of the long term picture.
Time to examine the price action more closely. Starting at the top.
The $DAX had a rough week. The beautiful breads and consistent coffee country had a tough one. Not only was it unable to break to the upside after a lower close last week, it stroked a big week with a 4% range. Huge compared to the recent price action. The interesting part was not much changed in the European news flow this week as Cyprus was the week before. It also took out the lows of the last 7 weeks in one weekly bar. Lastly, it moved to close just below the 20 WMA (see left legend). Just a brief scan of the recent price action shows that the 20 WMA has been good support. We'll see if it can get back above this level in the coming week. 2 weekly closes below support going into seasonal weakness would be adding to the concern pile when we are talking about one of the 3 strongest markets in the world currently.
Moving down to England and the world of clotted cream and Costa coffee. We had an outside week this week. That is the weekly bar went above the last week and moved down to close below the range of the previous week. Usually, that type of candle action is associated with tops. It can happen in the middle of the uptrend, but not nearly as often as it appears in tops. It also wiped out the gains of 8 weeks worth of work to close near the low of the range. While residing above the horizontal support line and the 20 WMA is hardly disturbing, the price action this week was. Something to watch.
The lattes and croissants market known as France made lower highs for the third week and closed below the 20 WMA. It also made lower lows. France is still making higher highs and higher lows on the bigger trend (multiple week view say 10-12) as well as holding inside the December to March range, but closer to the lows than the highs. The 3600 level is serious support. A sustained move below that would mark a test of the 3300 zone. Just a general note about the french chart. Of the 5 charts posted, France is a quick view of the average of the charts above and below. It has broken below the 20 WMA which now means 80% of these charts are below the 20 WMA. It may also be more bullishly interpreted as a leading indicator of breakouts to come for the Italian and Spanish markets as they seem to be one bounce behind France. Conversely, the failure of the formerly AAA french market to follow London and Germany above the 2011 highs is worrying for the broader European zone as it is the second largest economy in the monetary union called the Euro. Maybe it just needs another few months.
The Spanish market. The 'Spanish Coffee' and churros market took out the January lows and moved below the late December lows as well. This is definitely making lower highs and lower lows. It is very close to the top of the horizontal zone of support at 7750. The bottom would be 7500 and would make a head/shoulders topping pattern using the September 2012 highs as the left shoulder. This is a much shorter head/shoulders top than the big multi year bottom I have labelled on the chart. The previous four weeks saw the market touch the 20 WMA but failed to break above. Now it is clearly falling away from the uptrend support level.
The Italian market. Lavazza cappuccinos and brioches would normally make your day while sitting in Positano. However, after powering through previous resistance at 17K in January, the $MIB ran up against previously broken support at 18K. Rolling over into February, this market had almost no retest of the early January high that Spain did. It also did not get support at 17K after it broke through which is a failed breakout. It fell below its 20 WMA this week without trying to get above it again. It is testing the October/ November lows as the major support line. Dribbling around down to the 14900 line looks like it will happen. The real question is will it find support or just fail and fall below?
So lets summarize the view of the monthly and weekly. The last 3 years appears to be a fractal view of the last 15 years. Same pattern, shorter time frame. Having 40 % of the large European economies belwo their 20 MMA and 20 WMA is not a positive development after we had started a global bull late last year. Having 80% of these markets below the 20 WMA is very bearish for short term price action. This week matters in terms of the charts breaking down technically. My comment about 6 major markets being below the 20 MMA and Canada testing it on Friday is troublesome.
As Martin Pring mentioned on his presentation to the MTA in NYC, we are at a very pivotal time. The new bull market has not held together very well. Maybe it just needs a pullback to rev up the engines of growth.
Bottom line, even though the financial media are not covering this European market with any real depth, this past week behaved very poorly without 'new' news out of the region.
The question is, should I be ordering 'Brioches and Churros' or 'Clotted Creams and Breads' to describe the upcoming market action? " Excuse me....Barista....can I have a double shot espresso please?"
Good Trading,
Greg Schnell, CMT


