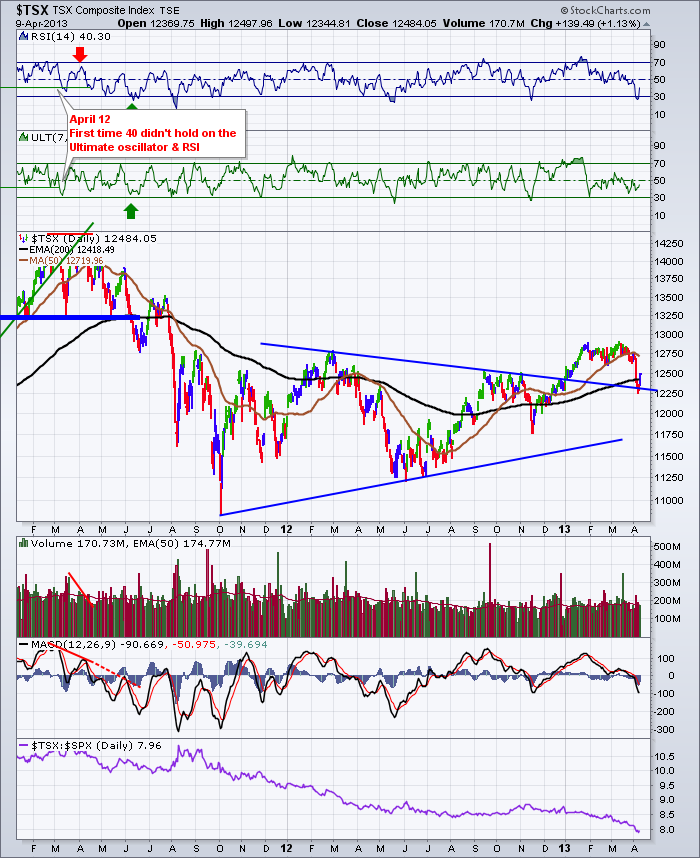
Well, the $TSX found a place to bounce from today.
What I like about this is we have a pattern called a backtest. It breaks out, pulls back to the neckline (usually horizontal but a downward slope works), and bounces from there.
As I was flipping through the charts for the CSTA meeting, I noticed the backtest. That is what makes saving your annotations so important. It can help you see things you might have missed.
If I had one concern, it did it on below average volume. We would like a 2% up day on significantly higher volume. So we worry. How does that compare to the big picture? Check these out below.
Three things make this bounce interesting.
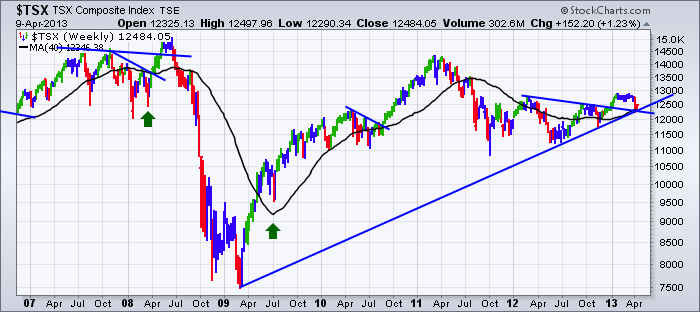
1) The 200 DMA or 40 WMA has turned up. So just a pullback in a new uptrend?
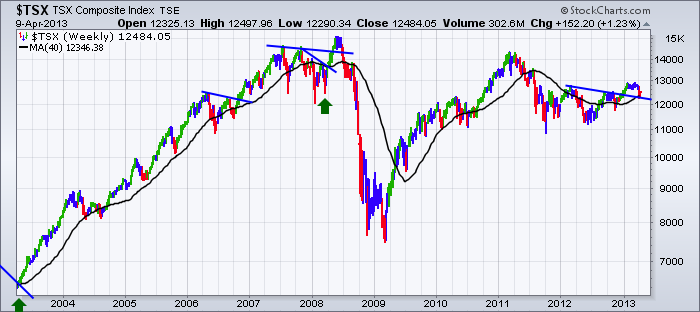
2) Previous multi year trendlines with substantial breakouts are not that rare. However, you can also see the 2008 top had the same dynamic.
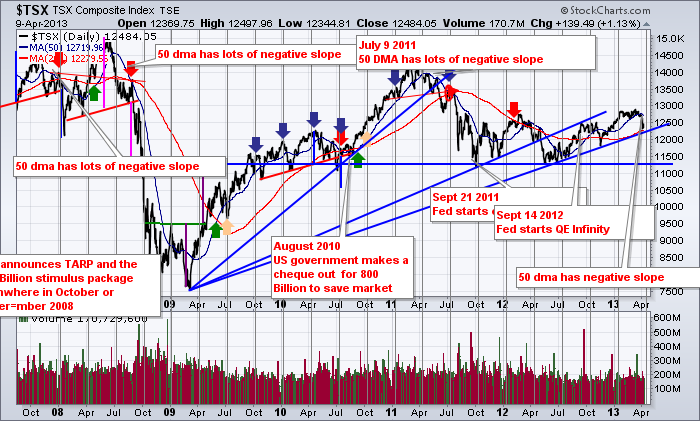
3) This was also a contact point with the 2009 uptrend line. If that trendline breaks, the bears will come pouring out of the woods. So, good to see the support.
If it fails at such a meaningful place on the chart (40 WMA and the MAJOR trendline), we would fire off a red alert!!!!!!!
The upsloping 200 DMA / 40 WMA is support. The 50 DMA / 10 WMA has already failed and has turned down, which is very bearish. But no bull market ever started without having a down trending market first!
It is a time for caution with the 50 DMA turning down. It is a time for optimism after a bounce off the 200 DMA and the major trendlines. Did the fund managers join the party today? It would have been nice if they would have significantly stroked the volume. Bottom line, the price action out of this zone is crucial for next steps.
Good Trading,
Greg Schnell, CMT


