While perusing the ticker cloud on the homepage, I noticed Cameco sitting there.
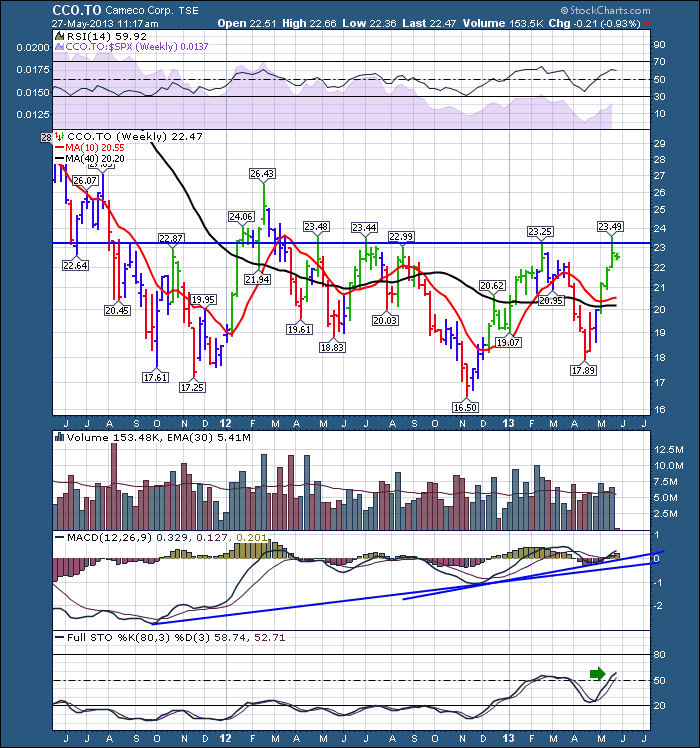
Here is a chart of Cameco. Cameco is one of the worlds largest Uranium miners. Between the stock market recession, the fallout from Fukushima and the unloved status of commodities this industry has struggled. Cameco has been a range bound stock. Cameco has been working to try and break out of the range it has been stuck in for over year. One of the interesting developments is the Full sto's have made new highs even though the price action is still range bound. That is a bullish sign.
So, if we investigate how the full Sto's are calculated in the chartschool tab, we learn that it uses the location of the close to help decipher the change in trend. Here is the link. Stochastics
"Developed by George C. Lane in the late 1950s, the Stochastic Oscillator is a momentum indicator that shows the location of the close relative to the high-low range over a set number of periods. According to an interview with Lane, the Stochastic Oscillator "doesn't follow price, it doesn't follow volume or anything like that. It follows the speed or the momentum of price. As a rule, the momentum changes direction before price." As such, bullish and bearish divergences in the Stochastic Oscillator can be used to foreshadow reversals. This was the first, and most important, signal that Lane identified. Lane also used this oscillator to identify bull and bear set-ups to anticipate a future reversal. Because the Stochastic Oscillator is range bound, is also useful for identifying overbought and oversold levels."
So on the present rally, this is a very bullish change. A breakout above the range would confirm the change.
Good trading,
Greg Schnell, CMT


