The first scan we created found stocks that are in the top 25% list technically. The second scan focused in on stocks just entering the top 25% list. This scan will look for stocks that have momentum relative to the broad group. I would equate this to a 2 lane highway analogy.
Image courtesy of signalimages.ca
Almost all the cars are moving at pretty much the same speed, and then suddenly, one car puts on the left signal, pulls out and passes 10 cars in a row. "Where's the fire?". In the stock world, we want to find these stocks that are breaking away from the pack and changing their momentum. This can be caused by a couple of different scenarios. One is that the rest of the stocks are pulling back as the market moves back, but this stock is rising during the same period. Second is that the market is rising, but a new industry group is taking the leadership role. As that happens, stocks within that group start to move up faster than the average stocks.
So how can we find these stocks? Lets work on that now.
Let's go to the advanced scan workbench and get started.
From the members tab, scroll down to the scan line. Click on the far right hand side, create a new scan.
That brings us to the scan criteria and the scan builder boxes.
We want to insert some simple clauses from the scan builder and then alter them.
We are going to go down to the scan builder. Select the SCTR you are working with. I am working with SCTR.tsx. I scroll down to SCTR.tsx and insert it. It should bring up one line that says:
and [SCTR.tsx > 90]
We need to edit two things on the line. I am sure many of you guessed it, but we need to remove the 'and' at the front so the square bracket starts the first clause.
[SCTR.tsx > 90]
Next we will change the value to 75.
[SCTR.tsx > 75]
Go down to the scan builder and insert the same SCTR.tsx line again. For the second command, we are going to change the expression to look like this. It is important that you use the digital 5, rather than spelling out five.
and [5 days ago SCTR.tsx < 60]
You can also add other parameters if you are interested. This is where you start to get specific. Hopefully you are feeling comfortable with the scan engine now.
This would be a line to keep the average volume above 60000.
and [ Daily SMA(20, daily volume) > 60000]
This would be a line to keep the average price above $2.00
and [ Daily SMA(20, daily close) > 2]
Check your syntax to make sure the scan lines are working. Now add in your comment lines. Place your scan title on the first line. Give instructions on the following lines as to what the purpose of the scan is and where to store the results. We are going to put the results in 6022. My finished version looks like this.
//6022.1 Strong stocks moving up fast.
//This scans purpose is just to create a list of rapidly rising stocks in Canada based on the SCTR.
//Dump these into a Scan Dump folder, run the scan again and merge into 6022 STRONG STOCKS MOVING UP NOW
// This will keep a very active watch list!!
//This can be used to identify stocks on a daily basis that are moving up rapidly in strength.

// looking for very strong stocks
[SCTR.tsx > 75]
//Only a few days ago, the SCTR was below 60
and [5 days ago SCTR.tsx < 60]
Let's save the scan as 6022.1 Strong Stocks Moving Up Fast. Put one copy of the results in your 6022 chartlist. Run the scan again and replace the contents of a temporary scan folder.
On this Wednesday morning, I got these results.

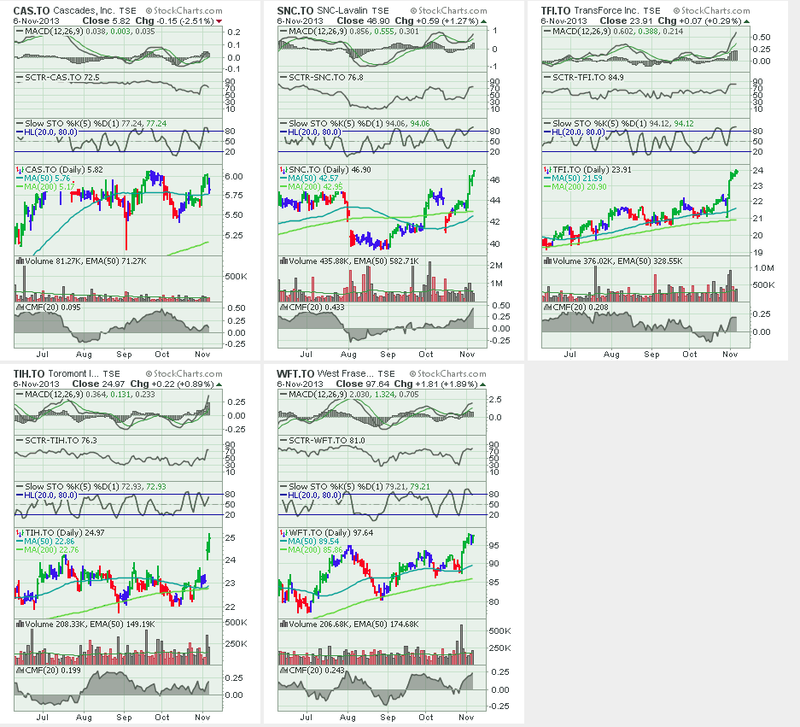
So when I scan the results, I see two from Industrial, and one each in Financial, Cyclicals and Materials. All of them have ok volume for Canadian stocks. US based investors might chuckle at the volume but it is typical in Canadian stocks. Sometimes, it will all be from a particular sector or industry group. That is a nice clue.
I think the 5 stocks look beautiful. Here is a CandleGlance view taken in the afternoon after Wednesday's market close. The scan was in the morning.
A few have pulled back. A few kept surging. But this is a very impressive place on the chart. Notice how all the charts were making moves above previous resistance levels. The exception would be Cascades chart. It hasn't quite been able to push above the previous highs. You can see the broad consolidation at $5.75.
Let's review a chart of the well studied AAPL for clues about this scan.
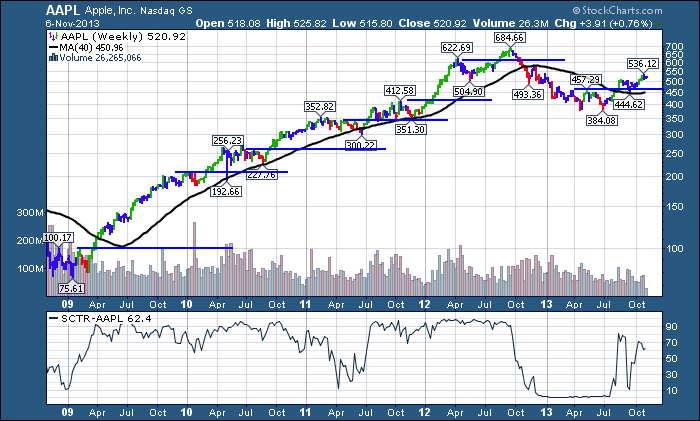
I note seven similar places on the AAPL 5 year chart where AAPL pushes above a previous resistance after price moved in a horizontal range. After being in a zone of consolidation, look at these price moves as they broke above the previous ranges. This was the launch point.
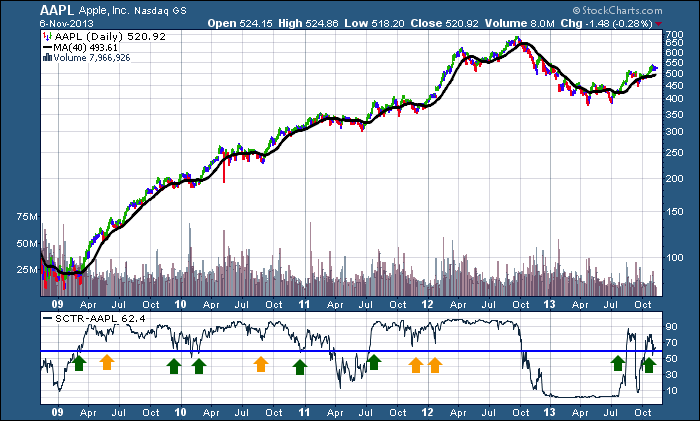
Now let's look on the SCTR response around those same places. I have changed the chart to daily, so we could see each day's SCTR result, not just the end of week result on the weekly.
We can see pushes off or above the 60 level on the SCTR are marked with green arrows. The orange arrows are marking surges off the 70 level. The green arrows mark surges from 60-75. Interestingly, the last breakout in late July 2012 before AAPL rolled over had no surge. Recently, AAPL pushed up to 80 and fell back below the 60 level again. You can see in the SCTR indicator window on the left the level is currently 62.4. In late 2009 it took a few trys to get it going. You can see 4 bounces off the 60. Looking ahead, we don't know how the AAPL story is going to work out. MSFT spent 11 years improving cash flow and profit while the stock migrated sideways after its final high in Dec 1999. Apple clearly has some work to do. The bottom line is it could go either way. It does have the activist investor pestering the CEO. They may do some shareholder friendly things. So if a person was going to invest in this, it has met our criteria for a place where we would expect it to jump up from. It recently had two occurences of quick spikes meeting our criteria. Both since July. We will see. But when we start with strong stocks technically, there are some clues that the scan engine can help us with. The pullbacks can be buying opportunities. That is why we don't delete strong stocks that have pulled back from the main list right away. They make great stocks to find on pullbacks. Some of those trades won't work out, but you are definitely starting from a position of better probabilities than the bottom dweller in terms of buying on a pullback. It would also appear that when we look back at AAPL, below 50 was a pretty ominous sign. Let's keep that in mind.
So this wraps up our intro into the scanning for strong stocks moving up. One was the stock moving above the 76,78 or 80 SCTR level. This one was a passing lane scan where it moved up 15 SCTR points within a week.
Next we are going to do some scans for pullbacks. I randomly pulled AAPL for my example of breakouts above previous resistance, however, it has pulled back to the 60 level. That is an important place on the AAPL chart so maybe we should test that as an interesting scan. Looking for strong stocks where the SCTR has dropped to the low 60's. Another scan will be using a stochastics indicator. You'll never guess where I learned about that particular indicator setting. You can see the indicator on my CandleGlance view settings. We can also use it to help signal strong stocks that are starting to weaken technically to help us sell in a timely fashion.
I am receiving some comments every day that people are really finding this SCTR system helpful. I have received a few emails where people had trouble getting it working. Send me an email. Let me help you get it working for you. Some have set it up on ETF's, Sp500, small caps. Some are already modifying the scans to add other criteria. This methodology is a base to help develop your skills on the Stockcharts.com website. It should also help you find interesting entries for profitable trades. The SCU 101 and SCU 102 courses are filled with stuff like this.
Chip and I are in Dallas today to present the SCU101 and SCU 102 classes. Gatis Roze is with us to present the first 300 level course. I'll try to publish a few more scans this week. Time will be a little tight. Speaking of that, we will be doing a Stockcharts course in Vancouver in January. One of the world's best ski villages in Whistler Mountain. If you are a skier, this January course might be dreamy timing for you to continue onto a vacation at Whistler/Blackcomb. Nice when you have to leave the beauty of Vancouver only to follow the sea to sky highway to arrive at Whistler.
Good Trading,
Greg Schnell, CMT


