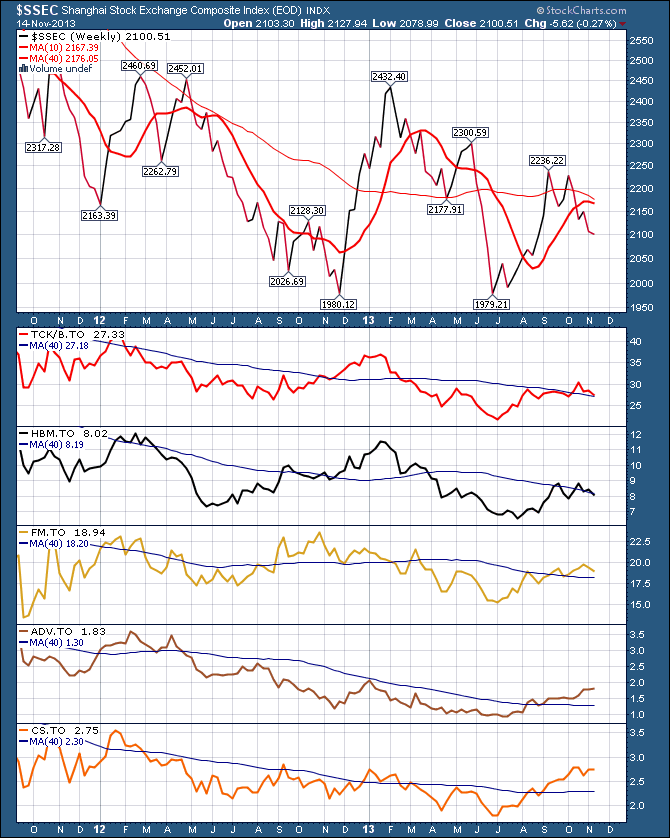
The materials markets are behaving very oddly here.
Oil, Gold, and Copper are all below the 200 DMA. Teck Resources, First Quantum Minerals, and HudBay Minerals are all below their 200 DMA. But Westshore Terminals has been on a nice move up, Capstone (copper miner) has launched, and Australia just announced record exports of Iron Ore.
US stocks have been vertical with FCX and X both moving well north of the 200 DMA. The 4 year $CRB chart has had a massive head/shoulders top formation and we lost the trendline support 2 weeks ago. It is this odd divergence that leads me to the opening sentence for this blog.
It is not uncommon for the stocks to lead the materials. The interesting part is the $SSEC has been making lower highs and lower lows for at least a couple of months. The $HSI (Hang Seng) is making 2 month lows this week, and the 200 DMA is just below here. The monthly charts have the $HSI up against solid resistance and it recently pulled back from an attempted breakout.
It is so tempting to join in these stocks that are breaking out as they try to move higher. It is jittery as this commodity rally looks to be dying, but the stocks seem levitated from the reality. Maybe its the commodities that are not reflecting reality yet, and the commodity based equities are breaking out.
For sure its a moment of interest on the charts. If the Commodity sector can rally from here these miners could put some serious profits in the portfolio. Importantly, failing to get above at the 40 WMA gives great clues what to do. If you have a rule of a particular moving average that you will not buy a stock that is sitting below, say the 200 DMA (40 WMA), then you know what to do. If you don't, you are torn as the temptation is there.
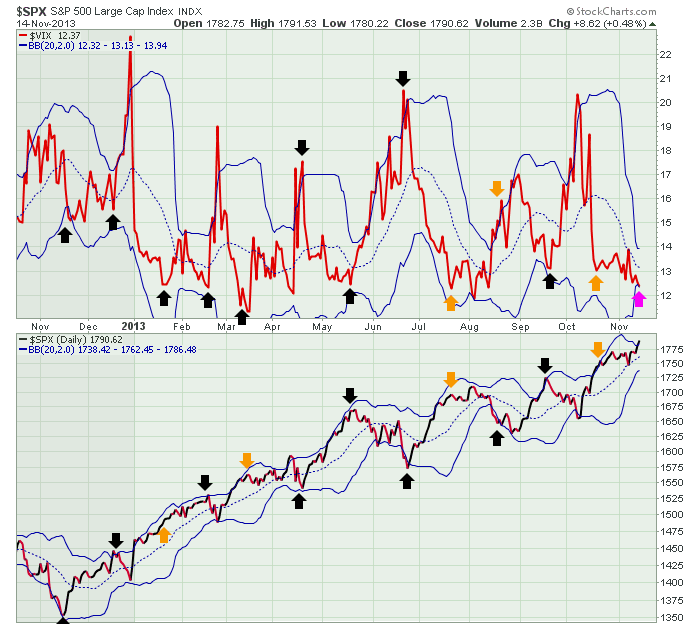
Tomorrow is options expiration. The $VIX reversals and therefore the $SPX reversals have happened each month beside 9 of 12 OE days this year.
If tomorrow is the same trend, we can expect volatility to increase on Monday. The $SPX closed above the Bollinger band today, and the $VIX closed below. Black arrows show a reversal, Orange is no reversal. Notice both the $SPX and $VIX are outside their BB's on the close today.
The other thing to notice is that the $VIX is rarely near the middle of the bands for OE. It is usually on the outside edge or closer to the outside edge.
We'll see what this month brings. I won't be surprised to see an immediate pickup in volatility come Monday or Tuesday! That seems to be what this series of events would have me believe.
Good trading,
Greg Schnell, CMT


