I think I start every post about $COPPER that it is a great leading indicator. Well, it might be an economic activity indicator, but it sure isn't a good indicator of US stock market direction.
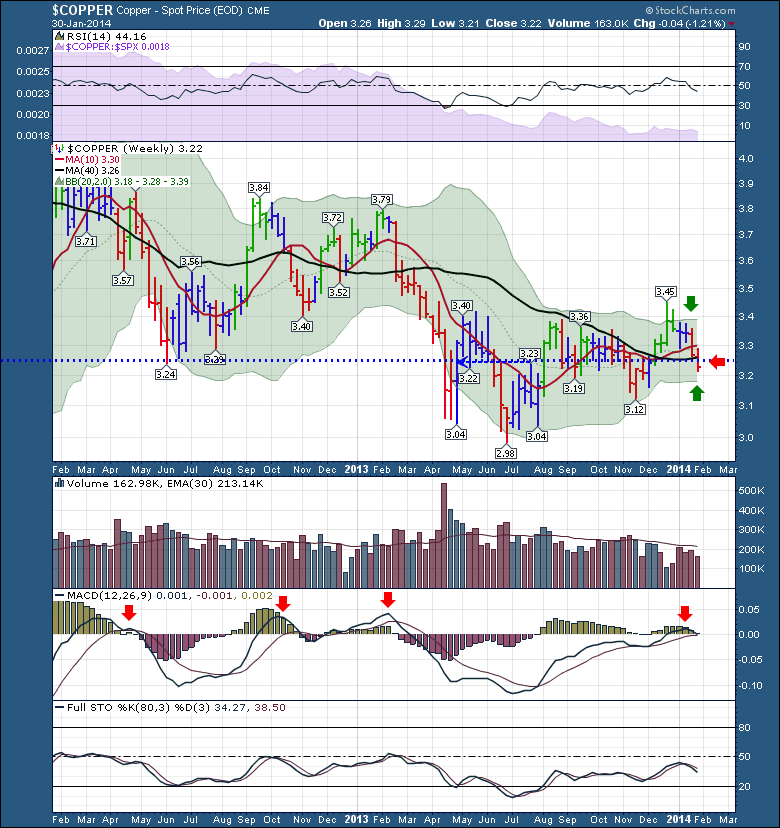
First of all, we can see the RSI is stuck below 65 which is a bear market. That's true! The SPURS behind the RSI are still underperforming, even though the materials sector has had a bit of a run recently.
The price action on Copper could not be more interesting. After stroking a final high in early February last year, $Copper took a Winnebago out of town. After falling $0.80 to lose about at 20% of the value, it has now been making higher highs and higher lows since July. Even though the $SSEC (Shanghai) market is not tilted in an upslope like this chart is, $copper seems to have some strength. One of the most promising signs was a recent jump above $3.40 to charge outside the upper Bollinger Band. Only to mark a spike top and roll over! Now $Copper has made lower highs every week for 6 weeks. This week was particularly concerning. Not only did it continue falling after breaking down below the 10 WMA last week, this week $Copper also broke down through a blue dotted line that marks the centre of the consolidation. We have one more marker to still find support at. That would be the lower Bollinger Band and the location of an up trend line off the lows. Lastly, the Bollinger Bands are at their narrowest in two years. That could be a positive!
The volume has been weak, with no panic selling. So perhaps that's good! The MACD looks like it is rolling over here. The end of day update should probably be enough to switch this to a confirmed cross down. The Full Sto's are still in bear market mode.
If I list the commodities under the 40 WMA, it is long. $LUMBER was trying to hold above a trend line today after breaking down through it earlier in the week. $WTIC and $GASO are both below the 40 WMA. Lots of the Ag components are below as well.
Once again it seems to me to be an extremely important place on the charts with all the major world markets breaking down and the emerging market currencies putting in a major 4 year rounded top.
I feel like the whole thing could implode from below, which makes me think I should do the opposite and go long. The end of the world is only a successful bet once! Emotion is not usually a good directional indicator of the trend you should trade!
Good trading,
Greg Schnell, CMT


