Every now and then a stock comes along that just drives you crazy. Cenovus has to be one of those story stocks. Given the keys to the oil empire in the split from Encana, Cenovus looked promising from every aspect. As a large Canadian company with the ability to produce major growth rates in production from the Christina Lake and Foster Creek projects, the investing community came to expect great things from this company.
I reviewed their January 2014 Presentation to find out the Oilsands technology they are using has a $45/bbl production cost. They have mitigated 85% of the Heavy oil discount. They have grown the oil production by 50% in the last 2 years! This presentation makes you feel like their should be a rocket attached to the stock price. They own two US refineries and would love to put their oil on the Keystone XL pipeline. So that appears to be holding them back.
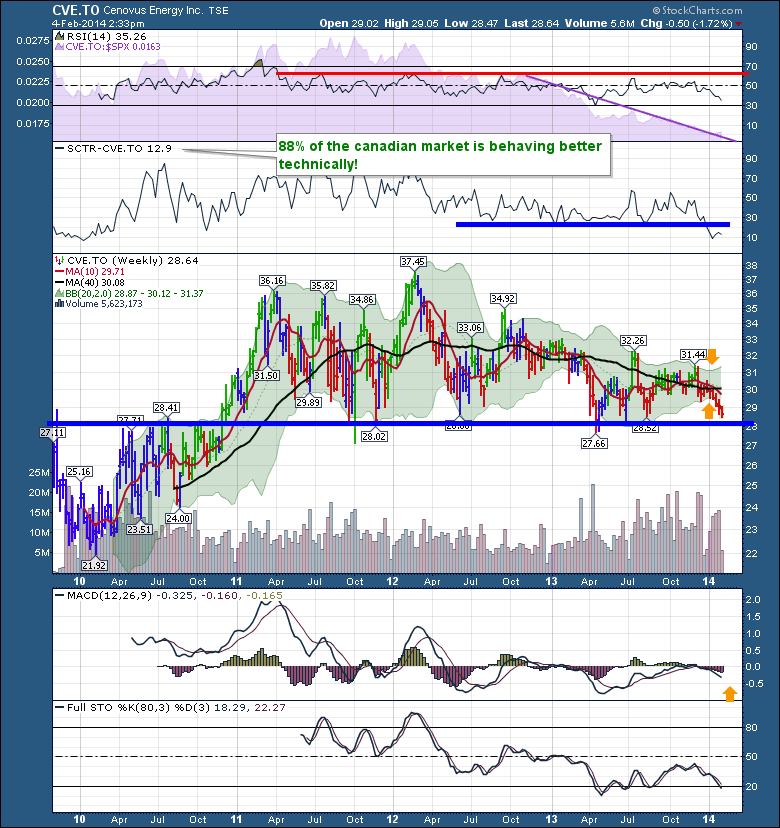
OK, so this should be a monster stock. Let's look at the chart. Starting at the top. The RSI has been trapped under 65 for most of 3 years. The relative performance to the SP500 in purple (SPURS) is showing underperformance for 2 years. The SCTR ranking shows Cenovus as being a below 50% stock for the last year. The recent news is it just crashed in relative ranking to every other $TSX stock to become the bottom 15% technically. That sounds like last quartile performance which can only be construed as poor.
Lets look at the price chart. You could have bought this stock for $28 and change in the second week after the IPO. Holding it today, you would have made dividends. But chances are the holders that bought it at almost any time in the last three years are under water. Its had 9 red weekly candles in a row including this week. The 10 WMA is below the 40 WMA. The 40 WMA and the 10 WMA are down sloping. On the big picture, this has been downsloping for a while. Lower highs and lower lows since March 2012. OUCH!!!!!!!!.
Briefly onto the MACD, failed at the zero line and pointed lower. The full sto's sinking into oversold again.
Why would anyone by this stock? Well, it had a great story, yadda yadda yadda. But that would have created a lot of pain for the last 3 years. It is also in a down trend so traders are more likely to find stocks moving up by investing during an up trend. An investor in this stock is trying to buy something out of favor and waiting for a long time for the true value to be reflected. The Warren Way. Notice when Warren was buying into Suncor.
As a technical investor, let's look at the chart from a different perspective. Let's try to find the positives in this chart, knowing the growth rate of the underlying company.
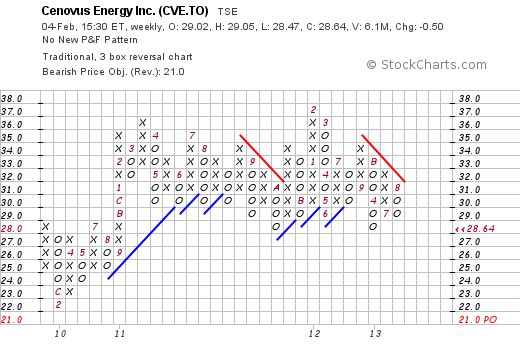
1) It's near 3 year lows which is a bargain hunting methodology. If you put a stop under your buying price, you could have a very safe stop at $27.00. Why $27? We'll look at the PnF chart to see that would be a breakdown low. On a candlestick chart, maybe $0.20 under 27.66 at $27.46.That is the lowest low in three years. That is less than 4% away from the price.
2) The full Sto's (80,3) are oversold.
3) The Bollinger Bands are at the tightest point they have been in on the entire chart. In 2012 they tightened up, only to continue into a major breakdown. Bollinger Band tightening usually occurs before big moves either way. So this could be one clue of a meaningful turn, either way.
4) The Full Sto's are in oversold, but the MACD momentum is not nearly as negative as the most recent low. So having the price being at a similar low, but the momentum being less negative could be a great indicator of a strong entry point. We have to wait for a turn up though to finalize that clue. Rather than throwing this chart in the garbage, it might be time to look for an entry if that happens.
5) An entry based on the highest price in 2 weeks would probably let you into this chart with some safety and a close stop.
Let's look at another chart for some ideas. Here is a PnF chart.
This chart will not put another 'o' in until the price reaches at least $28.00. So currently we have the opportunity to buy stock at the lowest box on the historical chart. This is where the big money looks to build positions. The technicians from the large investing companies like Fidelity love finding these opportunities. Companies with a great growth profile that are currently are out of favor. Where do they want to buy? Right at previous support.
Why the discussion on this stock? I don't own it. I know a few employees there that are doing so many things right, but the stock has not seen any return. (Have not talked to any of them in more than 6 months) I am in a mental conundrum over the lack of growth or breakout in commodities in general. This is very worrisome for me. But having a low risk entry with a tight stop would be very advantageous if the friction holding this stock down starts to disappear. Like a Keystone pipeline approval as an example. Wink Wink, Nudge Nudge. That might be just the trigger to change this chart direction. 90 or 120 days out?
So back to the title. Cenovus might have blindsided fundamental investors with all the growth they are building, only to have the stock go down. Eventually, the blanket of doom covering this stock will lift. Perhaps its a month, perhaps its a year. The first clue will be a tight focus on the stock price action, not the fundamentals of the company changing meaningfully.
You can set an alert if you are an extra or pro level member. Currently a $29.80 entry price would be slightly above the high of 2 weeks ago. You can keep moving the alert down until it pulls you in. A one week ago entry high is still $29.50. Am I recommending the stock here? No. It seems to still have negative momentum and the more times it tests this $28.00 level the less likely it is to hold. But following the stock price down until it makes a higher high on the weekly chart is the minimum for an aggressive entry for an investor. A less aggressive investor might wait for a 3 week high. Lastly is the day trader, who enters on a test of the $28.25 low on June 24th and tries to bottom tick the stock and make the range between the low and the 2 week high. How would you play a stock like this? Nice to hear the technique that works for you if you like buying stocks under the 200 DMA (40 WMA).
Good trading,
Greg Schnell, CMT


