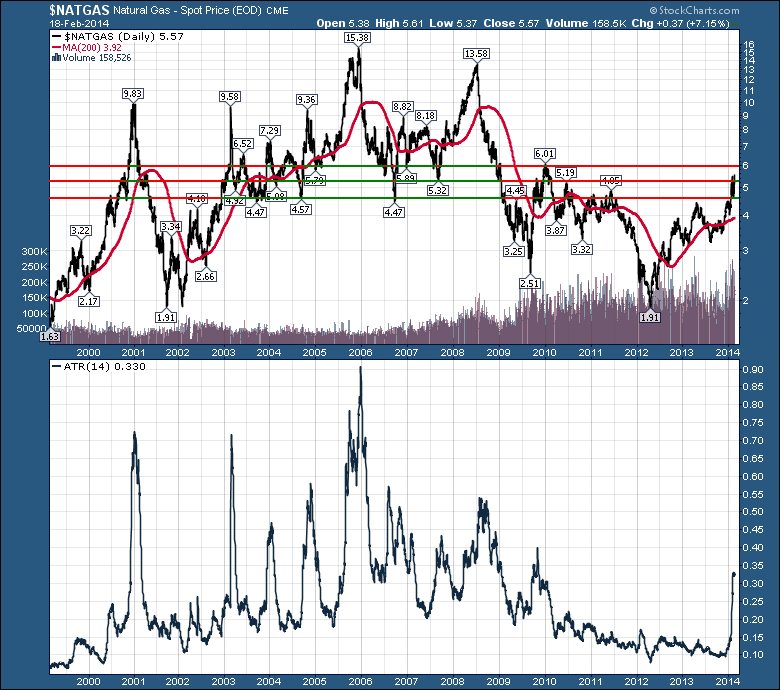
As the winter weather sits in snow banks across Eastern North America, $NATGAS has been on a roll.
I expected the top to be in for $NATGAS based on the change in the size of the daily moves and a seasonal top in late January early Feb for $NATGAS. Yesterday, $NATGAS had its highest close in a few years, and this morning in futures trading is sits in the $5.90 range.
Short term, I think that ...yadda, yadda, yadda. I was expecting $NATGAS to top out and roll over.
Long term, outside recent memory the chart has some very interesting history.
I have placed 3 lines on the chart. When $NATGAS surged from below to above the bottom line, it went all the way north of $9.50. Once was in late 2000.
Once in early 2003, when equities were coming out of a nasty downturn, $NATGAS was in the$5.86 high on Valentines day. It rose above the lower line late in 2002. By February 25th it went all the way to $9.58. That is a 50% increase in 10 days.
The move in 2009 could qualify also and that stopped out at $6.01.
Currently the daily volatility (ATR) has moved to be higher than 5% / day at $0.33 which is higher than any time in the last 4 years on a cents/day basis.
At this point, $NATGAS could find resistance at $6 or blow right on through to extreme levels. At this point, the best advice is to be very, very nimble.
Good trading,
Greg Schnell, CMT


